
The summaries in the Report Findings section of this report provide top-level views and synopsis of all 77 North American utility respondents combined. In the Data Tables section of the report, survey results are cross-tabulated by size and type of responding utility.
The Newton-Evans 2014 sample for this study represents a total of at least 32,594,000 end-use customers, 2,019 transmission substations and 7,649 distribution substations in the United States and Canada. The sample distribution of North American utilities in this study is similar to previous year studies. About one-fifth of the responding utilities are U.S. Investor-owned, 36% are public power utilities, 32% are cooperatives and 12% of the respondents in the sample are Canadian provincials and municipals.
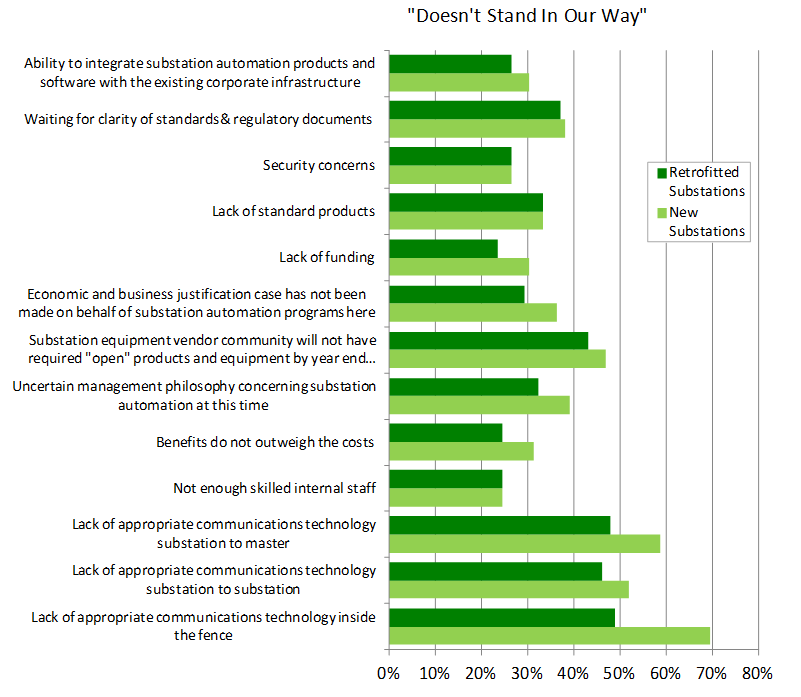
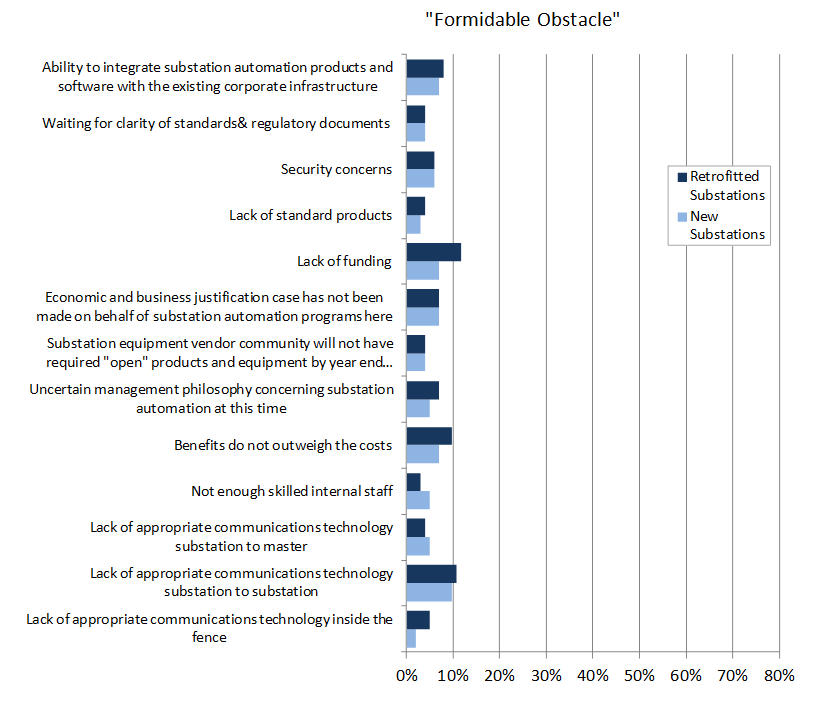
1. Please rank the significance from 1 to 5 for all of the following listed “potential obstacles” to implementing substation automation and integration for both new and retrofit substations through year-end 2016. Use: “1 = doesn’t stand in our way” to “5 = formidable obstacle.”
Just as in 2011, utilities seem to be least concerned with “lack of appropriate communications technology inside the fence.” For new substations, 69% of respondents said this “doesn’t stand in our way,” and for retrofitted substations, 48% said the same. “Lack of funding” for retrofitted substations seemed to be a potential obstacle, with 51% rating it a 3 or higher. This was also the chief obstacle in 2011, although “security concerns” was rated a 4 or higher by 33% of the same group. The current survey shows only 20%-24% of utilities in the sample rating “security concerns” a 4 or higher.
More information on how to order volume 1 or other volumes of this report series is available on our reports page.
 summary reviews and highlights from completed studies