

Where are the controls located for FDIR/FLISR on your distribution system?
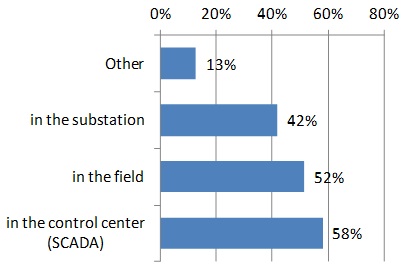
As had been observed and reported din earlier Newton-Evans studies of distribution automation, respondents continue to provide a mix of replies to this question. Among the 42% of utility officials indicating some implementation of FDIR/FLISR on their distribution system, many have controls implemented at two or three locations. Among the 31 utilities identified as current FDIR/FLISR user utilities, controls were listed as being located at the control center (58%), in the substation (45%) and in the field (52%).
Location of controls for 31 respondents who have feeder automation and/or FLISR
In the future, where do you anticipate the controls to be located for FDIR/FLISR?
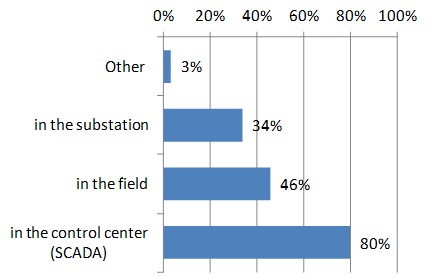
Interestingly, control placement for FDIR/FLISR in the future is anticipated to be primarily in the control center, as cited by 67% of all respondents. Nearly 40% indicated future control location in the field, while 29% cited plans for substation-based controls. Eighteen percent of all respondents indicated no plans (at year-end 2014) for feeder automation.
Importantly, regardless of type or size of responding utility, the majority of participating utilities plan to use the control center based systems to manage field equipment.
Location of controls for 59 respondents who have plans for feeder automation and/or FLISR
Where are the controls located for Volt/Var control on your distribution system?
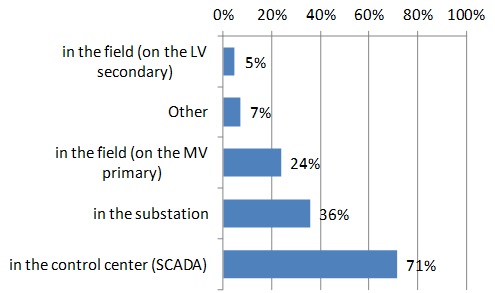
Thirty-one utilities responding to this question indicated that they do not currently have feeder automation or VVC in place. Of 42 utilities that have feeder automation or VVC, only five percent indicated having VVC implemented in the field on the LV secondary, while 24% had implemented controls on (some of) the MV primary feeders in their distribution networks. Thirty-six percent of the respondents cited having VVC controls implemented in the substation, while 71% reported VVC controls at the control center-based SCADA system.
Location of controls for 42 respondents who have feeder automation and/or VVC
In the future, where do you anticipate the controls to be located for Volt/Var control?
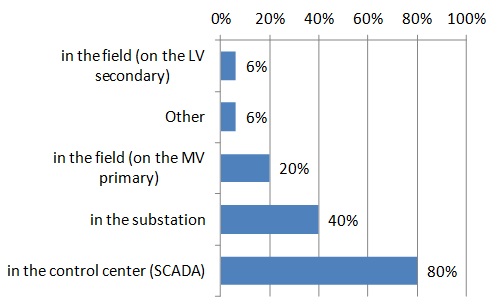
When asked about future location of Volt/Var controls, nearly three quarters indicated that these would be likely to be in the control center. Nonetheless, 38% also cited plans to implement VVC control in the substation while18% indicated possible control placement on the MV primary feeder, and seven percent on the LV secondary feeder.
It seems particularly important for IOUs and utilities serving more than 100,000 customers to have control-center-based controls for VVC applications.
Location of controls for 65 respondents who have plans for feeder automation and/or VVC
Does your utility use automatic fault sensing (AFS) devices (hot line status, fault indicators) in your feeder design?
More than one half of the respondents reported current use of AFS devices in their feeder design. An additional 19% plan to include AFS devices in feeder designs over the next three years. Utility Co-ops were not as likely to be using AFS devices as were the other subgroups of utilities, as noted in Table 11. IOUs and Canadian utility officials indicated use of AFS devices moreso than their counterparts at cooperatives and municipals.
Both the current usage levels and plans for use of AFS devices were strongest among the larger utilities (in terms of customers/feeders).
If you do use automatic fault sensing, do you utilize the status of the communicating automatic fault sensing devices in your distribution automation applications?
Of the subgroup of respondents that had indicated use of AFS devices, 34% reported that they utilize the status of such devices in their distribution automation schemes. Fifty percent of public utilities and 44% of utilities with 500,000 or more customers reported using the status of communicating AFS devices in their DA applications.
 summary reviews and highlights from completed studies