
According to the U.S. Department of Energy’s Energy Information Administration, annual spending on electricity distribution systems by major U.S. utilities continued to increase year-over-year through 2019, with major utilities spending some $57.4 billion on electric distribution in that last pre-pandemic year. More than half of utility distribution spending in 2019 went toward capital investment ($31.4 billion) as utilities worked to replace, upgrade, and extend existing infrastructure. Another $14.6 billion was invested in operations and maintenance (O&M), and $11.5 billion was appropriated for customer expenses, which included advertising, billing, and customer service.
In 2019, much of the $31.4 billion distribution system capital investment (40%) was spent on power lines, both underground (23% of investment) and overhead (17% of investment). Distribution lines are added or expanded to accommodate new neighborhood development or higher electricity flows as sales increase.1
Keep in mind that when spending by municipal electric utilities and electric cooperatives are added to the EIA totals, the amounts reported by EIA actually would increase by about 25-30%, at least in our estimation. The bulk of this additional non-IOU spending was for distribution expenditures.
We have increased these amounts for 2020 and 2021, if only to account for inflationary pressures on prices of electrical equipment and systems. Thus, our view is that, in 2021, about $60 Billion was spent in total, on electric power distribution activities in the United States. Of this amount, $33 Billion was estimated for capital investment, and about $20 Billion of the total went for distribution equipment and systems.
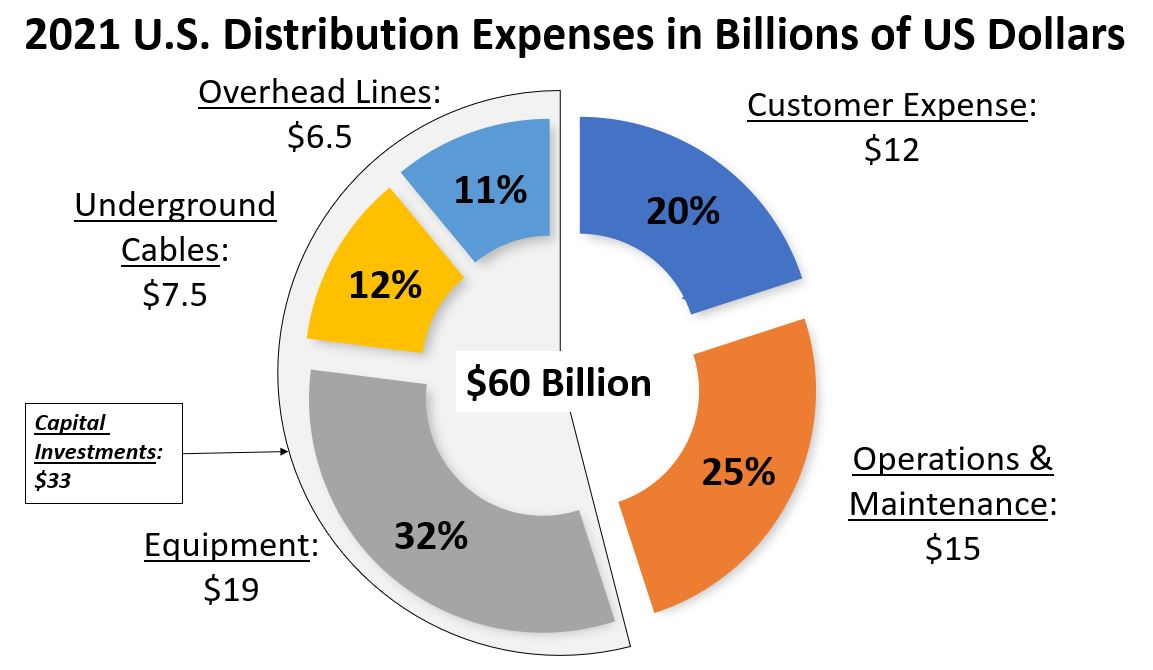
Fig. 1
Newton-Evans’ recent year studies of U.S. combined utility and industrial/commercial spending for dozens of specific T&D products, equipment types and systems suggest about $22 Billion was invested in about 70 specific T&D equipment types in 2021.2 Note that this estimate includes spending for both transmission and distribution. In fact, the total expenditures for T&D procurements likely exceeded 100 billion dollars. See Figure 2.
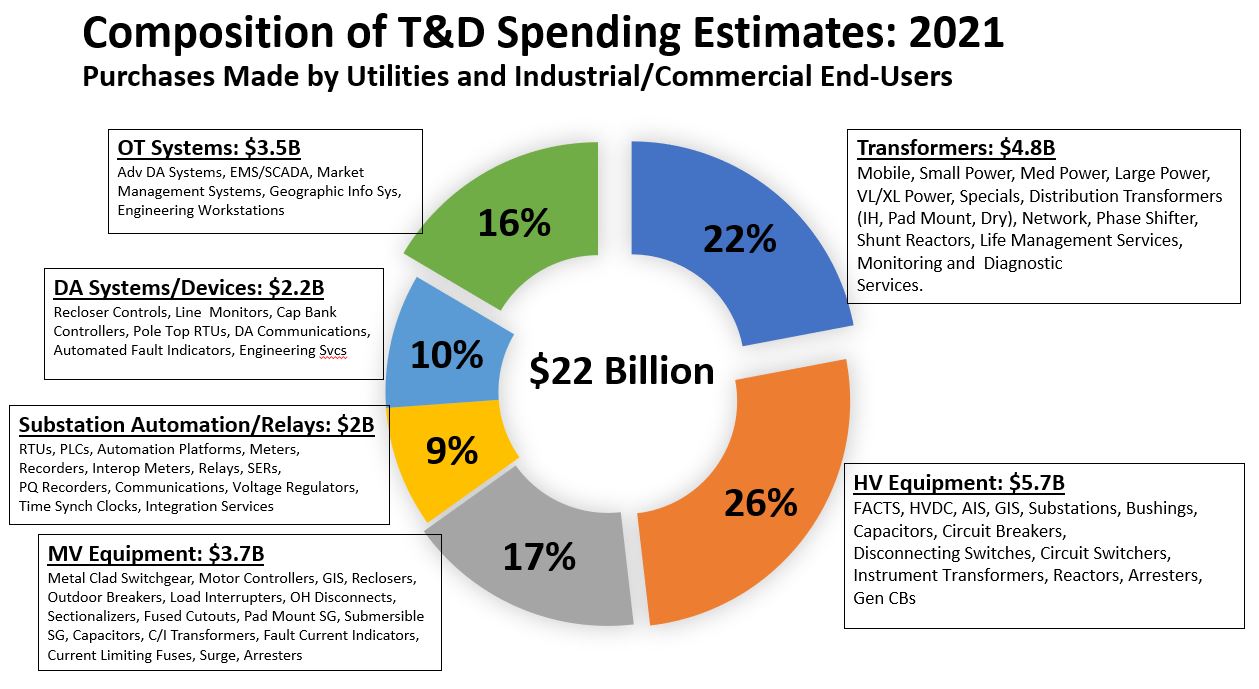
Fig. 2
This $22 Billion shown in the above chart excludes additional billions of dollars invested in power lines, underground cables, electric power poles, meters and ancillary equipment as well as customer-related spending, certain substation construction and O&M services.
One recent Newton-Evans’ study of capital investment changes brought on by the COVID pandemic, resulted in an expected drop in CAPEX from 2019 to 2020, followed by stabilization and a moderate increase in spending for some areas in 2021. Some respondents cited this as a “deferral” of investments rather than a cancellation of investments at the time of the study.3 Nonetheless, total capital investment by U.S. electric utilities during the 2020 and 2021 years likely centered around the $130 Billion mark.4
If the nation (and the entire world) can move on from the ongoing pandemic era, to an endemic period, grid modernization investment may recover some of the momentum lost or deferred from the past 24 months. As well, the significance of the passage of the Infrastructure Investment and Jobs Act in November, 2021, cannot be overstated. More than $60 Billion dollars of funding under this new act has been allocated to the energy sector, most of that amount earmarked for modernization of the electric grid.
Sources:
1. U.S. Department of Energy, Energy Information Administration
2. Newton-Evans’ Market Overview Series on various T&D Topics
3. Newton-Evans Research Study of Capital Investment among U.S. Utilities in Midst of Pandemic Conditions (1-2 Quarters, 2020)
4. Newton-Evans Calculations of 1.28 x EEI/EIA estimate of $107 B. Newton-Evans’ estimate very similar to estimate prepared by Statista, which itself was sourced in part from S&P Global Market data.
 summary reviews and highlights from completed studies