Growth in real market demand for electrical equipment remains quite strong, but is lower in mid-2026 than total year-over year market dollar value increases would suggest. This is largely due to goods manufacturing cost pressures, caused by rising spot market prices for key commodities used in the production of electrical equipment. Key among these components are copper, electrical steel and aluminum. These commodities are under significant price pressures and production capacity limits, and right now, while GOES steel prices have leveled off over the past six months, copper and aluminum prices have continued their upward spiral, and are among the principal reasons for increasing electrical equipment manufacturing costs, resulting in higher capital equipment prices being paid by utilities and industrial/commercial buyers.
Equipment prices (especially for power and distribution transformers, for HV/MV switchgear and for capital HV transmission equipment) have doubled in the last five years, even as real demand has grown as well in spite of higher prices. However, overall equipment demand has grown almost as fast as have component cost increases. These same commodity price increases have affected equipment production costs and together with increased demand (primarily from utilities undertaking grid modernization efforts, and C&I buyers of all types and sizes) have together resulted in increased and a stretch out of order placement-to-delivery times for a range of MV equipment as well as for HV equipment along with power and distribution transformers.
What seems to be different as of the mid-2026 market composition versus that of just five years ago is that a higher percentage of electrical infrastructure equipment is now being purchased by end-user industrials and commercial enterprises than had earlier been the situation. Chief among these relatively newer buyers are data center developers and large renewables project owners as well as hundreds of American manufacturing plants being expended or on shored. Also, the re-invigoration of the nation’s electric power grid is well underway, in an attempt to make electricity supply more abundant, more secure, more sustainable, and more reliable. Together these efforts will result in electricity grid infrastructure becoming more resilient to the effects of climate challenges and surges in the peaks and valleys of electricity consumption in the coming years.
Much of the increase in demand for capital electrical equipment is coming from three sectors of large energy users.
First is the continuing growth of renewables, despite the mistaken erosion of interest in, and significant cutbacks of, research funding on the part of the current administration and its Department of Energy.
Secondly is the huge increase in the number and size of data centers, especially those supporting AI developments.
Thirdly is the reshoring of manufacturing industries, with numerous large industrial campus developments underway at this time.
Each of these is responsible for placing capital electrical equipment orders earlier than required, sometimes 2-5 years in advance of the projected need for the equipment to be installed and operating at a plant site.
Each of these factors impact and disrupt the historical cyclical equipment procurement activities of electric utilities of all types and sizes.
By staying the course toward availability, reliability and resilience, electric power utilities will necessarily form alliances with non-utility providers of electric power. Concurrently, I believe we will see an increases in some new large campus-like industrial and large commercial sites developed that will be at least partially self-powered, using resources ranging from gas turbines, to small modular nuclear reactors to on-site utility-scale renewable solar farms and wind parks. A newer and more sustainable form of auto-production and co-generation is being developed by, and for use among, manufacturers, data centers and utility-scale renewables sites.
When we evaluate current mid-year costs for key components of electrical equipment, we must look into the cost changes that have occurred over the past 30 months. The following table was developed using commercial market information sources as of July 30, 2026. Note that the cost/unit of GOES steel in the U.S. market has actually fallen from its high-water mark incurred in 2024 until January of this year. This has resulted in a five percent drop in price/metric ton over this time interval. GOES has now remained at this somewhat lower price level for an additional six months – through July, 2026. However, note the continuation of rather steep cost increases for units of copper (+64%) and aluminum (+44%) over the past 30 months, whether measured in units of pounds, kilograms or and especially in metric tons (MTs).
Much of the information reviewed for preparation of this article discussed the heretofore relative stability of aluminum prices as compared to the volatility of copper prices. However, it seems that in recent years, aluminum costs have surged as well, including a jump of some 44% over the last 30 months. The increases just from January through July this year are also significant for both copper and aluminum, and show no signs of significantly slowing down.
In reviewing cost components for large power transformers, copper (used for windings) comprises about 30-45% of the component costs for large power transformers. For distribution transformers, aluminum windings account for about 25-35% share of material costs. An excellent tutorial is available from Maddox Transformers that discusses selection of copper versus aluminum windings. Here is the link: https://www.maddox.com/resources/articles/aluminum-vs-copper-in-distribution-transformers .
Switchgear manufacturing costs are also significantly impacted by the fluctuations in the market prices for copper and/or for aluminum. Internet sources have indicated that when used for critical applications and at higher voltage switchgear, copper as a key component can account for as much as 40-45% of total material costs.
Look for our next article to be published in early August that will review the latest electrical equipment price trend information provided by the Federal Reserve.
The medium voltage equipment market in the U.S. is comprised of multiple types of equipment both large and small, some getting more expensive per unit while others have tended to remain available at a relatively stable price range over the past few years. The 2026-2028 edition of the Medium Voltage Equipment series of Market Overviews will be available in mid-July. This article provides some of the highlights from the upcoming series.
There are some segments of the MV equipment market that have now crossed the billion-dollar threshold and others have climbed into the hundreds of millions over the past three years, comprising the post-COVID era.
Importantly, commercial and industrial procurement of MV equipment have picked up substantially, in large part due to the rise of commercial developments including data centers and business campuses, and the re-shoring of multiple industrial facilities and the growth of utility-scale renewables facilities. The U.S. has added hundreds of new MV substations and added a few thousand distribution line miles as well since 2023.
The combined C&I segments purchase the majority of air-insulated metal-clad switchgear, MV gas-insulated switchgear, motor controllers, pad mounted switchgear, and comprise large shares of many other MV equipment categories. In total, Newton-Evans estimates that the C&I segment of the nation’s MV equipment market is now about 36% of the total and growing faster than the distribution utility segment. Industrial reshoring and plant expansions, along with large scale commercial developments, including data centers, are fueling this growth.
The commercial and industrial (C&I) segment of the T&D equipment and services market is currently growing as fast in many areas as is the utility market segment. Both segments are doing well for almost every category of equipment that is reported in the 2026-2028 edition of the MV Market Overview series. See Figure 1 below.
The C&I segment includes all non-utility owned power generation, transmission and distribution assets. Over the coming decade, more and more of the very large commercial and industrial sites are likely to become experienced owners/operators of power generation and T&D assets. Industry terms that have been around for decades including auto-generators and co-generators will again become widely associated with the developments of future data centers, commercial multi-site campuses and large industrial facilities. Utilities will be looked to for partnering, technical expertise, cooperative planning and perhaps joint purchase agreements for constructing and maintaining non-utility-owned G, T and D assets.
Topics covered in the 2026-2028 series of market overviews for MV equipment include individual report summaries covering major types of switchgear (air-insulated metal-clad, GIS, load interrupters, pad mount, submersible); reclosers and sectionalizers, outdoor circuit breakers, overhead disconnect switches, fused cutouts, substation class capacitors, instrument transformers, fault current limiters and Fault current indicators, current limiting fuses and fuse links and surge arresters.
At least two of these categories currently account for more than one billion dollars in domestic sales per year, while the value of shipments for five additional categories are more than $500 million in annual shipments to U.S. customers.
Combined revenue estimates for five types of MV switchgear account for just over one-half (53%) of the estimated value of all 17 equipment categories in the new report series. This assessment excludes the several hundred million dollars in shipments of overhead disconnect switches. See Figure 2 below.
Each of the 17 reports in the MV Market Overview series includes definitions of what is understood as the product segment, listings of key market participants and their estimated 2025 revenue, a market share assessment (pie chart), 2025 market size range estimates, and an outlook of estimated spending changes through 2028.
The data for these MV Market Overview reports has been obtained through secondary research, interviews with equipment/systems suppliers, industry consultants, the U.S. Department of Commerce, and from information gathered from more than 200 earlier Newton-Evans survey-based studies conducted through mid-2026.
The Newton-Evans HV Equipment Market Overview series of reports for 2026-2028 includes a total of 15 market snapshots or overviews for a variety of HV equipment. The HV equipment totals for major components of substation equipment and transmission network installation excludes additional even larger expenditures for transmission lines/cables, structures/towers, land acquisition, ROW and transmission-related IT/OT investments. An excellent guide to HV substation project costs is provided in the MISO Transmission Cost Estimation Guide for 2025, which can be found here: https://cdn.misoenergy.orgMISO%20Transmission%20Cost%20Estimation%20Guide%20for%20MTEP25337433.pdf This guide provides a wide array of related cost assumptions that include ancillary equipment related costs as well as some estimates of current-year equipment prices and project overhead costs. The Newton-Evans’ estimated outlay of expenditures for U.S. HV and MV substation construction activities reached about $5.4 billion in 2025, while total estimated spending for all HV equipment categories other than power transformers, reached about the $6.1 billion level. The estimates shown in Figure 1 below includes total estimated spending for HV equipment being purchased in conjunction with new substation developments (bundled procurement) as well as the amounts purchased for equipment retrofits and upgrades in existing substations and network locations (“loose” procurement). Power transformers, substation automation and P&C topics are treated separately from HV equipment in our market overview series of studies. For Figure 1, we have included our estimate of spending for LPTs. The entire range of power transformers included in the total costs for HV substations amounted to an additional $4.3 billion. You can read up on U.S. power transformer market estimates here: https://www.newton-evans.com/highlights-of-the-newly-released-2026-2028-newton-evans-market-overview-series-on-substation-automation/
Note that our estimates account for only about one-half of all reported capital expenditures for U.S. transmission activities. Our estimates exclude the additional billions of dollars that are spent for new/uprated transmission lines, cables and supporting structures/towers and for land acquisition and transmission software/IT-OT development. A listing of all HV equipment summary reports included in this year’s series of market overviews can be found here: https://www.newton-evans.com/product/overview-of-the-2026-2028-u-s-transmission-and-distribution-equipment-market-high-voltage-series/.
A Current Look at HVDC Activities in the United States includes excerpts from the Newton-Evans publication entitled Overview of the 2026-2028 Transmission and Distribution Equipment Market: High Voltage Series, to be released in early May, 2026. HVDC is one of 15 topical HV equipment market overviews included in the series.
A High Voltage, Direct Current (HVDC) electric power transmission system uses direct current for the bulk transmission of electrical power, in contrast with the more common alternating current systems. For long-distance transmission, HVDC systems may be less expensive and suffer lower electrical losses. For underwater power cables, HVDC avoids the heavy currents required to charge and discharge the cable capacitance each cycle. Two main cost components are the converter stations and the cable.
When assessing the current U.S. market and near-term outlook for HVDC projects and for annual revenue flows to traditional suppliers of electrical equipment used in the construction of HVDC converter stations, Newton-Evans estimates such project flows currently running at nearly one-half billion dollars per year. Leading suppliers of HVDC equipment for converter stations (inclusive of any involvement in converter station construction and maintenance) are Hitachi Energy and Siemens Energy. Other market participants with some millions in revenue flows for multi-year projects and for maintenance revenues for operational sites include GE Vernova, MEPPI, Toshiba and others.
Recently,The Brattle Group collaborated with DNV to prepare an excellent update to the original 2023 report entitled “The Operational and Market Benefits of HVDC to System Operators.” This updated 2025 guide is entitled “Market and Operational Benefits of HVDC Systems” The guide is available to download courtesy of the report sponsors: https://cleanenergygrid.org/wp-content/uploads/2025/02/Pfeifenberger_HVDC-Transmission_WCEA-2-05-25.pdf.
Average Project Cost Ranges
Typically, equipment manufacturers do not state specific cost information of a particular project since this is a commercial matter between the manufacturer and the client, which, in the case of HVDC projects is usually a non-utility corporation/LLC that is set up specifically for managing the HVDC project.
Costs vary widely depending on the specifics of the project such as power rating, circuit length, overhead vs. underground/underwater route, land costs, and AC network improvements required at either terminal. A detailed evaluation of DC vs. AC cost may be required where there is no clear technical advantage to DC transmission alone and only economics drives the selection. Typically, the longer the transmission route, the more cost-effective can be HVDC.
There are a handful of HVDC U.S.-based projects either about to get underway or planned for construction during this outlook period (2026-2028). Several more remain on the drawing board awaiting the required routing approvals and funding from multiple parties. Each project we have found is estimated to cost well over one billion dollars. Only a portion of that total project cost will be awarded to one of more of the suppliers for HVDC converter stations. However, each award to the above suppliers will be worth multiple millions of dollars when ongoing maintenance and periodic upgrade revenues are included.
Since the 2021-2023 edition of our HV Equipment Market Overview series of reports, some projects have been cancelled or indefinitely postponed. These include Plains and Eastern Clean Energy Link; Rock Island Clean Line and Juan de Fuca Cable HVDC. Since our last report in 2024, the Clean Path New York project has also been shelved. The current (April 2026) U.S. HVDC projects underway, about to begin, or still in the pipeline of possibilities, include a total of nine named projects that Newton-Evans Research has uncovered. Together, these nine projects are valued at around $45-50 billion of investment. It appears to Newton-Evans that either Hitachi Energy or Siemens Energy are either the selected – or highly likely candidates for providing converter station equipment for each of these listed projects.
The newly published 2026-2028 edition of the Market Overview Series for Substation Automation includes 14 topical reports on modern substation components. In total, U.S. spending for these 14 categories of substation devices and equipment is likely to exceed $3.8 billion in 2026, rising to about $4.2 billion just 24 months later. These expenditures are in addition to the estimated $5.4 billion planned for substation development this year. Some sources anticipate more than $40 billion is likely to be spent on new substation construction activities in total. The key drivers for all of this expected activity include the rapid growth of AI data centers, ongoing development of utility-scale renewable projects, and the reshoring of American manufacturing locations. Incentives for rapid build-out of the nation’s transmission grid have never been more necessary than at the present time.
More information on the entire 14-report series of substation automation components can be found here: https://www.newton-evans.com/product/overview-of-the-2026-2028-u-s-transmission-and-distribution-equipment-market-substation-automation-series/ The complete 2026-2028 series is priced at $1,750.00, with individual 3-5 page report summaries available for $195 per report. Each report provides component definitions, revenue estimates of key suppliers, market share assessments, outlook through 2028, and revenue split between sales to utilities and commercial-industrial buyers.
Two groups of transformer manufacturers are active in the U.S. electric power industry.
Large power transformer manufacturers include the global Big Three equipment suppliers to the electric power industry (Hitachi Energy, GE Vernova, Siemens Energy), along with specialist power transformer manufacturers including Delta Star, HICO America, Hitachi, Hyundai, MEPPI, Pennsylvania Transformer, Virginia Transformer, and WEG.
Distribution transformer manufacturers include the Big Three, plus several North American-owned companies including ERMCO, Howard Industries, Eaton, Central Maloney, Maddox, Hammond HPS, Schneider Electric and Carte International and several others.
Domestic sales of power transformers from 30 MVA and up were well over $2 Billion in 2025. The Newton-Evans chart below shows what we believe is the dollar value range of actual unit shipments of power and distribution transformers for 2025. The “bookings level” for 2026 and for the next few years remains above these estimated shipment values, due in large part to the extended lead times for unit delivery of power transformers.
Our newly revised chart attempting to show the transformer demand–supply imbalance curves over the 2025-2030 years follows. Note our belief that the extended delays in transformer deliveries will ease over the coming few years as more and more new and updated transformer manufacturing facilities come on line in the U.S. There is good news in light of the announced 27 new U.S.-based transformer manufacturing facilities or major plant addition announcements made by more than 20 manufacturers over the recent 24 months.
Findings from the new transformer market overview series include estimates of 2025 shipments of power and distribution transformers and the combined revenues of transformer services with transformer monitoring and diagnostic equipment. The estimated shipment values are shown in the slide below.
Growth in real market demand is significantly lower than total year-over year market value increases would suggest. This is largely due to inflationary pressures, caused by rising prices for key commodities used in the production of electrical equipment. Key among these components are copper, electrical steel and aluminum. These commodities are under significant price pressures and production capacity limits, and are among the principal reasons for continually rising electrical equipment manufacturing costs.
Equipment prices (especially for power and distribution transformers, for switchgear and for capital HV transmission equipment) have doubled in the last five years, even as real demand has grown as well, but not as fast as inflationary pressures. These same inflationary pressures affected the production costs and increased prices for MV equipment as well as for HV equipment.
What seems to be different in today’s market composition versus that of a decade ago is that a higher percentage of electrical infrastructure equipment is now being purchased by end-user industrials and commercial enterprises than had earlier been the situation. Chief among these buyers are data center developers and large renewables project owners as well as the reshoring of American manufacturing plants. Also, the re-invigoration of the nation’s electric power grid is well underway, in an attempt to make electricity supply more secure, sustainable, more reliable, as well as becoming more resilient to the effects of climate change and climate challenges.
Much of the increase in demand for capital electrical equipment is coming from three sectors of large energy users.
First is the continuing growth of renewables, despite the mistaken erosion of interest and significant cutbacks of research funding on the part of the current administration and its Department of Energy.
Secondly is the huge increase in the number and size of data centers supporting AI developments.
Thirdly is the reshoring of manufacturing industries, with numerous large industrial campus developments underway at this time.
Each of these are responsible for placing capital electrical equipment orders earlier than required, sometimes 2-5 years in advance of the projected need for the equipment to be installed and operating at a plant site.
Each of these factors impact and disrupt the historical cyclical equipment procurement activities of electric utilities of all types and sizes.
The electric power segment of the overall energy industry is indeed continuing to proceed with its transition from a fossil-fuel based power generation basis to a more sustainable and greener approach to providing reliable and resilient electric energy.
By staying the course toward reliability and resilience, electric power utilities will necessarily form alliances with non-utility providers of electric power. Concurrently, I believe we will see some new large campus-like industrial sites developed that will be self-powered, using resources ranging from gas turbines, to small modular nuclear reactors to on-site utility-scale renewable solar farms and wind parks. A newer and sustainable form of autoproduction and co-generation is being developed by and for use among manufacturers, data centers and utility-scale renewables sites.
When we evaluate current year costs for key components of electrical equipment, we must look into the cost changes that have occurred over the past 24 months. The following table was developed at Newton-Evans using commercial market information sources. Note that the cost/unit of GOES steel had actually fallen from its high-water mark incurred in 2024 until this January, resulting in a five percent drop in price/unit over this time interval However, note the rather steep cost increases for units of copper (+31%) and aluminum (26%), whether measured in units of pounds, kilograms or metric tons (MTs).
One of the principal resources I have used and relied on over the years has been the economic information produced by the Federal Reserve Bank of St. Louis. The information on producer prices is published for dozens of commodities, and for many of these, the data is updated on a monthly basis. This vast array of economic research is known as FRED – for federal reserve economic data. Now in its 35th year, FRED is a major reliable source of business-related economic information vital to industry and commerce in the USA and internationally.
We are looking at FRED data in this article to help understand the huge increases in producer prices (manufacturing-related costs) that have affected the electrical equipment manufacturing industry. In this first chart, one can view the rather steep rise in producer prices that have occurred over 20 years. Note the sharp increases in the producer price curve beginning in the COVID era.
The second chart shows the steep rise in transformer producer prices that have been incurred over the past five years, nearly doubling on this index rising from 200 to more than 360 on the scale. Note that while it took 20 years for costs to double (from 100 in the base year of 2000) to a level of about 200 in 2020, it will likely take fewer than six years for transformer production costs to again double.
The final chart shows more of the same type of producer price rises, but includes power transmission equipment and turbines in this array.
Earlier this month (January 2026) The North American Electric Reliability Corporation (NERC) published its annual landmark study of transmission projects from across the United States. More than 1000 projects were documented and described in its annual report can view the status of U.S. transmission projects as of year-end 2025 reader.
There were about 62 project cancellations or delays due to a variety of reasons including economic considerations, load growth issues permitting issues and a few other considerations. The following chart illustrates the rationale provided for transmission project cancellations or significant delays.
The number of project cancellations and delays that occurred in 2025 was significantly lower (at 62 total) than the 142 such instances reported in the 2024 ES&D study. Our next topic will focus on the recent developments in the large power transformer segment of the industry.
For November, we discuss Customer Information Systems, Geographic Information Systems and Outage Management Systems as our three topics in our 4-part OT/IT series of articles. At the end of the article is the Newton-Evans estimate of software licensing revenue derived from these three application systems.
Customer Information System (CIS) is defined as the computer data base and information system that contains all billing and personal data pertaining to utility customers including billing rates, historical utility consumption, associated charges and meter information. According to Newton-Evans’ studies, a CIS is the “heart” of utility enterprise information technology and systems, just as an EMS is the “heart” of an operational technology base for a transmission utility and ADMS is becoming the heart of any major distribution utility.
A more advanced form of CIS – a customer relationship management system or CRM, is a set of software applications that enable utilities to manage every aspect of their relationship with a customer. In a CRM, Customer information acquired from metering, marketing, customer service and support is captured and stored in a centralized database. The system may provide data-mining facilities that support an opportunity management system. It may also be integrated with other systems such as accounting and marketing for a truly enterprise-wide system with multiple end-users.
In addition to our estimate of “hard dollar” expenditures reaching about $455 million in 2021, (mid-point within the range estimate of $420-490 Million), “soft dollar” internal IT expenditures invested by U.S. utilities on CIS maintenance and upgrades likely exceeds $2.25 billion each year. Some portion of this $2.25 Billion may also be contracted out to third parties directly supporting the utility CIS. The authors have separated CIS business models into the following three tables: CIS providers to Tier One utilities; Custom CIS developers to utilities; and CIS providers to mid-size and smaller utilities.
In the domestic U.S. CIS market, there are some large multi-national CIS suppliers that maintain or are building a U.S. market presence. These include India’s Fluentgrid, New Zealand’s Gentrack, Belgium’s Itineris and Spain’s Indra (Minsait ACS) among a few others.
Sources: Newton-Evans Research Company, CIS Vendor Websites, Gartner Peer Insights
CIS suppliers to the nation’s larger utilities serving 250,000 or more include Hansen Technologies, Harris Computer, Oracle, SAP, SAS and about 6 others. Companies that specialize in custom or tailored CIS solutions include Accenture, Aclara, Convergys, Infosys, IBM and others. Some are developers for Oracle, SAP or SAS offerings.
A third group of CIS specialist firms work with mid-size and smaller utilities providing cost-effective AUS Infinity, InHance and Cogsdale), along with CSA Utilitrak, Milsoft, NISC Meridian and Vertex One.
Total revenue achieved by this group of CIS providers across the three CIS Segments is likely in the $750-$900 million range for 2024, possibly exceeding one billion dollars in by 2026.
Market Drivers:
Some migration to SaaS platforms for CIS
Segment growth due to need for replacements/upgrades to legacy CIS/CRM systems.
Increasing linkage requirements between CIS and some OT-hybrid systems (OMS, GIS, MDMS et al).
Average Cost Range for Implementation of a CIS;
Wide range of costs for “packaged” solutions ($50,000 to low Millions). There is a qide range of costs for customization work: ($250,000 to multiple Million)
Geographic Information System (GIS)
A GIS ntegrates hardware, software, and data for capturing, managing, analyzing, and displaying all forms of geographically referenced information.
GIS allows users to view, understand, question, interpret, and visualize data in many ways that reveal relationships, patterns, and trends in the form of maps, globes, reports, and charts. The acronym GIS refers to the merging of cartography, statistical analysis, and database technology. For utilities, it most often means the geographical representation of the complete service area. For T&D operations, GIS provides significant advantages to visual awareness, operational support, outage location determination. Some forms of GIS are used for utility fleet routing (Caliper, for one example) while other forms are used for 3D mapping of utility physical assets like substations (Bentley, Trimble, ESRI GeoBIM, others).
Market participants across the nation include ESRI, Autodesk, Hexagon, GE Vernova {with its Smallworld, MapFrame and FieldSmart offerings) and Oracle with its Spatial and DB10g offerings. There are some important VARs active in this market that provide client tailoring of core solutions provided by the key software development firms. These VARs include companies like Schneider Electric, Caliper, Milsoft, WindMil, Trimble Benley, CADCorp, OGIS Precisely and others that work on a regional basis.
Dependent upon database size, number of seats, platform and other factors. Licensing costs may range from $40,000 upwards of $3-5 Million for large, multi-layered geospatial systems. Costs for GIS integration with OMS and/or EMS/SCADA is excluded from these observations.
Increased linkage with external GIS usage patterns among utility C&I customers.
Need exists for inclusion of non-utility-owned renewables assets in grid mapping.
Expanded use of low-cost or free, open-sourced GIS offerings for use in (mostly) smaller utilities.
OUTAGE MANAGEMENT SYSTEMS
At the core of a modern Outage Management System, as the term is used in this report, is a detailed network model of the distribution system. The utility’s Geographic Information System (GIS) is usually the source of this network model. By combining the locations of outage calls from customers, a rules engine is used to predict the locations of outages. For instance, since the distribution system is primarily tree-like or radial in design, all calls in a particular area downstream of a fuse could be inferred to be caused by a single fuse or circuit breaker upstream of the calls. Newton-Evans’ estimates for vendor-realized OMS-derived licensing revenue now exceeds $200 million on a “stand-alone” basis – that is, when purchased unbundled from a DMS/SCADA or ADMS.
Major functions typically found in an OMS include:
Identifying the location of fuse(s) or breaker(s) that operated to interrupt a circuit or portion of a circuit
Translating customer call patterns into specific “p/roblem” locations requiring response by line crews.
Prioritizing restoration efforts and managing resources based on defined criteria such as the size of outages, and the locations of critical facilities.
Providing accurate information on the extent of outages and number of customers affected.
Assisting with crew dispatching and tracking; management of crews assisting in restoration.
On the horizon, MV underground cable fault location analysis for partial discharge issues will become part of an extended OMS capability. Mobile workforce management also becoming more closely linked with OMS.
At least 11 OMS suppliers have a minimum of 3% market shares, making this a very crowded and competitive market segment.
Market Drivers include:
Regulatory rules changes affecting duration/extent of electric power outages.
Customer-driven requests for outage status reporting, MTTR information.
Emergency services preparations for initiating power resources are needed.
OMS market participants include (alphabetic order) AspenTech OSI, ETAP, GE Vernova, Hitachi Energy, Hexagon, Milsoft, Minsait ACS, Oracle, Schneider Electric, Siemens Energy, Survalent and a few other smaller firms.
Sources: Newton-Evans Research Company, DNV, CIS, GIS and OMS vendor websites
This chart provides a comparative view of the estimated software-licensing derived revenue for CIS, GIS and OMS licenses issued to U.S. electric utilities.
For October’s and November’s lead articles, we have developed overviews describing electric utility-related control systems on the OT side and in December will cover key administrative and business management systems from the IT side. This month’s lead article discusses the various aspects of energy management systems, supervisory control and data acquisition systems, and advanced distribution management systems.
Before a discussion of these three control systems begins, we must acknowledge the brave new world of OT being re- shaped and updated by the inclusion of artificial intelligence (AI) and machine learning (ML) in each of these control systems types. By late 2022, we began to see artificial intelligence playing a role in the project development side of major EMS, SCADA and ADMS suppliers. By 2025, commercial adaptation of AI has become widespread among energy systems suppliers for several critical applications, including improved load forecasting, dynamic load balancing, improving renewables integration efforts, and related areas including energy storage.
AI is enabling smarter, more efficient, and more sustainable electric power usage. AI’s ability to analyze vast data sets and identify complex patterns helps to optimize every stage, from energy generation and distribution to consumption. Over the coming years, AI will be integrated into more aspects of grid management and grid operations, improving reliability, safety and security for the world’s grid operators, large and small. Across the U.S., Ai will also play a pivotal role for ISOs and RTOs, as they continue to deal with integration requirements of non-utility participation in the transmission market.
An Energy Management System (EMS) is a suite of generation and transmission applications software tools used to monitor, control, and optimize the performance of generation and transmission systems designed to reduce energy consumption, improve the utilization of the system, increase reliability, and predict electrical system performance as well as optimize energy usage to reduce cost.
By 2019 vendors were taking note from the term ADMS and began using the term AEMS to indicate significant new capabilities including the integration of renewables and energy storage and their impact on grid operations and voltage stability. Coupled with the rapidly increased speed of processing and analyzing contingencies, and the ability to dispatch and curtail distributed energy resources, these developments have helped enhance operator capabilities and visibility into the real-time electric network. As the power generation mix and transmission requirements have become more complex, AEMS developments and capabilities are keeping pace with such needs. More recently, new iterations of generation management systems (GMS) have been developed that now include many of the generation-side applications that were (and continue to be) components of an EMS as described in our report on GMS (OT/IT11).
Three major components of a modern EMS include:
Native Services: data acquisition and control; graphical user interface; linkage/connectivity options to other systems; large database capabilities. There are many objectives of an energy management software including an application to maintain the frequency of a Power Distribution System and to keep tie-line power close to the scheduled values.
SCADA Services: load shedding, load restoration, network status; sequential control, switch order management, playback of historical events
Advanced Power Systems Applications (or Network Application Services): to include generation dispatching and control [AGC], transmission security management; voltage transient stability; unit commitment; state estimation, contingency analysis, demand forecast, and dispatcher training simulator. Added to these improved capabilities from earlier generations of EMS, are the abilities to work closely with and to better manage the influx of distributed energy resources and energy storage installations, the bulk of which may not be owned or operated directly by the utility. Finally, the adoption of the Common Information Model (CIM) across the industry has been a helpful development.
Sources: GE Digital Energy, ETAP, Hitachi Energy, OSII, PSC Consulting, Siemens Energy, Schneider Electric.
Among the benefits of modern EMS installations are the enhanced decision-making on the part of system operators enabled with AI. The role of digital twins will enable a more real-life training environment for new operators, as the newest iteration of simulation systems. Overall operational efficiency will be improved, providing greater grid stability, earlier detection of system anomalies, reduction in outage downtime and improved system safety for all.
Supervisory Control and Data Acquisition (SCADA) is a type of industrial control system (ICS). Industrial control systems are computer-controlled systems that monitor and control industrial processes that exist in the physical world. SCADA systems historically distinguish themselves from other ICS systems by being comprised of large-scale processes that can include multiple sites, and large distances. In addition, electric power distribution SCADA remains a more-or-less “open loop” type of control system, with human operators monitoring and supervising the actions of the control computer as it acquires data continuously from power substations and other remote locations, including third party operated distributed energy resource sites in an electric utility network, now marking more than 4,000 distinct utility-scale generation sites across the U.S.
Newton-Evans believes that there is a significant opportunity for providers of SCADA-related systems and application software to help manage the operations of commercially-owned utility-scale wind and solar power resources, as SCADA systems become more capable, adaptive, and scalable. By doing so, there will be somewhat of a more “closed loop” look-and-feel, but human operators will continue to play an important role and adapt to changing distribution network environments.
For more information on renewables SCADA opportunities, see https://www.newton- evans.com/scada-systems-for-the-renewables-energy-industry-and-adms-for-utilities/
Advanced Distribution Management Systems (ADMS) and Advanced Distribution Automation are terms used to describe the extension of intelligent control over electrical power grid functions to the distribution level and beyond. It is related to distribution automation that can be enabled via the smart grid. If we were to include all the possible components of a comprehensive ADMS, the U.S. market value would exceed $1 Billion. In this report, we are attempting to isolate ADMS core functions in a separate manner and retain individual product categories or sub-markets for OMS, GIS, WFMS, GMD, DERMS and others.
Typically, electric utilities with energy management systems have extensive control over transmission-level equipment, while Distribution SCADA offers increasing control over distribution-level substation-based data acquisition equipment (RTUs, PLCs and/or platforms and gateways). ADMS implementations provide additional utility operator monitoring and control capabilities over smart components in the distribution network beyond the substation using primarily wireless communications. In many ADMS installations, the same platforms are used, with additional applications implemented to provide coordination and control of automated field devices.
Gartner has defined an ADMS similarly, as follows: An advanced distribution management system (ADMS) is the software platform that supports the full suite of distribution management and optimization. An ADMS includes functions that automate outage restoration and optimize the performance of the distribution grid. ADMS functions being developed for electric utilities include fault location, isolation and restoration; volt/volt-ampere reactive optimization; conservation through voltage reduction; peak demand management; and support for microgrids and electric vehicles. https://www.gartner.com/en/information-technology/glossary/advanced-distribution-management-systems-adms
West Monroe further defines ADMS as: The ideology of an ADMS is simple—a modular system with an OMS, DMS, and Distribution SCADA (D-SCADA) at its core (as depicted in Figure 1).
The U.S. Department of Energy’s NREL has also provided a detailed roadmap for ADMS and states on its website:
The “advanced” elements of an ADMS go beyond traditional distribution management systems by providing next-generation control capabilities. These capabilities include the management of high penetrations of distributed energy resources (DERs), closed-loop interactions with building management systems, and tighter integration with utility tools for meter data management systems, asset data, and billing. https://www.nrel.gov/grid/advanced-distribution-management.html
U.S. market size estimates, shares and outlook for each system type are reported in the OT/IT Market Overview Series of 12 topical Newton-Evans’ reports.
In an electric power system, HV Air Insulated Switchgear is the combination of electrical disconnect switches, fuses or circuit breakers used to control, protect and isolate electrical equipment. Switchgear is used both to de-energize equipment to allow work to be done and to clear faults downstream. This type of equipment is important because it is linked directly to the reliability of the electricity supply.
High voltage switchgear was invented at the end of the 19th century for operating motors and other electric machines. The technology has been improved over time and can be used with voltages up to 1,100 kV. Typically, the switchgear in HV substations is located on both the high voltage and the low voltage side of large power transformers. Sources: Newton-Evans Research Company
Major suppliers active in the market include Hitachi Energy, GE Vernova, MEPPI and Siemens Energy. In the sub-transmission market segment, additional OEMs include Eaton, FedPac and Schneider. Sub-Transmission (>38.5kV-<110kv) prices ranged from $50,000 – $85,000 on recent year (2022-2024) bid tabulations.
Newton-Evans Research observations suggest that the high voltage air insulated switchgear market in the U.S. is rapidly approaching or by now has surpassed the $1 billion level by year-end 2024.
HV Gas-Insulated Switchgear (GIS) has conductors and contacts that in today’s market are still primarily insulated by pressurized sulfur hexafluoride gas (SF6). Gas insulated switchgear used for transmission-level voltages saves space compared with air-insulated equipment. Although it has a higher initial equipment cost, HV GI switchgear has experienced higher reliability and lower maintenance costs than comparable air-insulated switchgear. Alternative gases to SF6 are currently in development for mid-range HV applications among manufacturers and related GIS service providers. Commercialization of such alternative gases will provide additional growth incentives for potential GIS users.
High voltage gas-insulated switchgear for the U.S. market is manufactured by a relative handful of companies, and the additional key suppliers of MV gas-insulated switchgear include Eaton and Schneider in particular. The U.S. market appears to be about 250-300 bays per year – or about 20-25 HV GIS projects. Newton-Evans Research believes this market is primed for growth over the coming decade, at an AAGR of about 5% to 8% or better. Readers may wish to reference the HV04 overview report on Gas Insulated Substations.
Sources: Newton-Evans Research Company. (2017 landmark study for an HV GIS Market Participant. Updated reviews for another manufacturer completed in 2020. In 2022, a study of the outlook for non-SF6 gases on the market for GI switchgear was undertaken).
Key HV GIS equipment market participants include Hitachi Energy, Siemens Energy, GE Vernova and MEPPI, with HICO America, Hyundai and Toshiba also participating and growing their shares in this emerging market segment, likely to exceed $500 million in shipment values by 2026, in our view.
Dependent upon equipment configuration and voltage levels, prices for GIS equipment researched by Newton-Evans begin at about $100,000 and can easily exceed $1,000,000 for a platform- based, multi-bay EHV unit. Keep in mind that most U.S. HV GIS projects to date have involved between 10-20 bays.
It is important to note that GI switchgear is only one factor (albeit an important factor) in evaluating the cost of a complete HV GIS substation. Also, some gas-insulated switchgear is installed in air-insulated substations. In recent years, HV/MV GIS equipment has also been used in mobile substation applications.
High Voltage Bushings are hollow insulating liners that fit through a metal case (such as a power transformer), allowing a conductor to pass along its center and connect at both ends to other equipment. The purpose of the bushing is to keep the conductor insulated from the surface it is passing through. Bushings are often made of wet process fired porcelain, glazed to shed water. A semi-conducting glaze may be used to assist in equalizing the electrical potential gradient along the length of the bushing.
A bushing is an electrical engineering component that insulates a high-voltage conductor passing through a metal enclosure or a building. Bushings are needed on transformers, Buildings, Gas insulated switchgear (GIS), generators and other high-voltage equipment.
The inside of the bushing may contain paper insulation and the bushing is often filled with oil to provide additional insulation. Bushings for medium-voltage and low-voltage apparatus may be made of resins reinforced with paper. The use of polymer bushings for high voltage applications is becoming more common. The largest high-voltage bushings made are usually associated with HVDC converters.
Power transformer manufacturers typically produce bushings for their own equipment. There are a number of specialist producers of bushings and insulators as well (such as Lapp, NGK-Locke, Newell and others).
The HV bushings market is led by Hitachi Energy with a dominant market share of new bushings sold into the U.S. and remains as the leading supplier of replacement bushings for Type U bushings (formerly manufactured by GE) to the Utility and Industrial/Commercial markets in the United States. Newton-Evans estimates that Hitachi ABB currently has a 38-40% U.S. market share for HV bushings. Prior to the acquisition of ABB Power Grids, Hitachi held about an 8% share of the U.S. market for HV bushings, and ABB held about a 29%+ share.
An excellent reference article on HV/MV bushings can be found here on the INMR website: http://www.inmr.com/overview-world-markets-insulators-bushings-2/2/
Sources: Newton-Evans Research Company, Hitachi Energy, Trench
Bushing prices for HV installations range from about $2,500 upwards of $25,000 for an EHV bushing. (Price dependent upon country of manufacture, quantity, voltage, materials – polymer, porcelain, rubber, composite, etc.) One recent PJM study estimated an HV breaker bushing cost of $500,000. Note that while the HV bushings market in the U.S. is about $150-$180 million, the MV bushings market is larger, perhaps approaching $220 million, with more suppliers available. (Newton-Evans estimate).
High Voltage Power Capacitors play a key role in the transmission of electrical energy and are present in HVDC systems as well as in FACTS. (Trench). A power capacitor is an assembly of dielectric and electrodes in a container (case), with terminals brought out, that is intended to introduce capacitance into an electric power circuit (IEEE).
According to the Eaton Corporation, a capacitor is a device that stores energy within an electric field. This is achieved by having two oppositely charged electrical conductors separated by dielectric materials. Power capacitors are constructed of several smaller capacitors commonly referred to as “elements,” “windings” or “packs.” These elements are formed from multiple layers of aluminum foil (conductors) and polypropylene film (dielectric) wound together. When interconnected, multiple elements combine to function as a single capacitor unit. Elements are connected in series based on rated voltage, and in parallel based on required kvar. The completed module is enclosed in a hermetically sealed tank, and any air from the unit is removed and replaced with a dielectric fluid. Units include bushings with terminal caps, that are used as connection points and to maintain electrical creepage and clearance requirements.
Sources: IEEE, Trench Group, Eaton Corporation, Newton-Evans Research Company
Average Price Ranges For MV ranges, unit prices per price lists and a few bid sheets suggest current pricing is from $1,200-$4,900 depending upon voltage, KVAR, phases (1 or 3) and placement components. For HV range applications above 69kv, we could not find pricing information that is current enough to be listed here. However, based on one manufacturer’s configuration options page, HV 600KVAR units appear to be in the $17,000 and higher range. Some recent cost estimates published by various ISO/RTO organizations include: • 12 MVAR 115kV unit = $1 million • 24 MVAR 115kV unit = $500,000 • 100 MVAR 138kV unit = $2 million • 360 MVAR 230kV unit = $1.7 million • 150 MVAR 230kV unit = $1.25 million • 130 MVAR 230kV unit = $1.0 million • 150 MVAR 500kV unit – $1.5 million
A High Voltage Circuit Breaker (popularly known as HV CB or HV breaker) is an automatically operated electrical switch designed to protect an electrical circuit from damage caused by overload or short circuit. Its basic function is to detect a fault condition and, by interrupting continuity, to immediately discontinue electrical flow.
Electrical power transmission networks are protected and controlled by high-voltage breakers. The definition of high voltage varies but in power transmission work is usually thought to be 72.5 kV or higher, according to a recent definition by the International Electrotechnical Commission (IEC). High-voltage breakers are nearly always solenoid-operated, with current sensing protective relays operated through current transformers. In substations the protective relay scheme can be complex, protecting equipment and buses from various types of overloads or ground/earth faults. These units may be oil-based, air, vacuum or SF6 or other gas medium.
There are multiple sub-segments of the circuit breaker market based on specific kV ranges/offerings. The top tier manufacturers are competitive in each range from 72kV through 765kV – slight changes in leadership share positions in each sub-segment. GCB shipment values are excluded in the above totals – Generator circuit breakers are covered in the HV15 Market Overview. In the 550kV and higher classes, HICO and MEPPI are co-leaders, along with Hitachi Energy, GE and Siemens.
Some recent cost estimates published by the ISO/RTO community include: • 138kV 63kA breaker = $280,000 • 138kV 2000A breaker = $500,000 • 230kV 80kA breaker = $1.3 million • 345kV 63kA breaker = $1.08 million
Lower kV ranges of HV breakers (<245kV) account for about 57% of all HV unit shipment values (Newton-Evans estimates). As the U.S. adds additional new/uprated transmission capacity each year, the kV range continues to increase, albeit slower than anticipated over the last decade, but it may that 245kV, 362kV and even 550 kV unit shipments will eventually outpace growth of lower kV range units.
Due to the strong interest in our 2024-2026 edition of our Transformer Market Overview Series, we have this week produced and provided a mid-year updated outlook through 2028 to all current subscribers to this series. For readers that may be considering purchasing the 2024-2006 edition, but have not yet ordered the series, we will be providing the mid-2025 update for all new transformer series orders. We have already received compliments on our mid-year update from clients in the U.S. as well as internationally.
The 2024-2026 edition of Market Overview for HV Equipment includes 15 topical reports on modern high voltage and transmission-related equipment and systems. This month’s article presents some highlights from four of these market overview reports. In May and June, we provided a total of 14 summaries of modern substation components. Earlier this year, we provided articles on power and distribution transformers. Read the articles below today’s lead article for descriptions of the substation automation/digitalization market and for transformers.
First, lets take a look at what NERC’s year-end 2024 tabulations of transmission projects reveals in the accompanying three charts.
Here is a view (courtesy of STATISTA) of annual transmission capacity additions completed in the United States through 2024, that add to the total market opportunity for FACTS.
Next is a table developed by Newton-Evans Research indicating the status of 1,325 transmission projects from across the United States, as identified by NERC as of year-end 2024.
The third chart is provided to indicate the reasons given for project delays in transmission construction programs as of year-end 2024. This chart was also sourced from data provided in NERC’s 2024 Electricity and Supply report file.
Information from the NERC and related DOE files, along with utility surveys and supplier discussions are the basis for information provided in the entire 15-report series of high voltage equipment and power transmission system components prepared by Newton-Evans. Details and ordering information can be found here: https://www.newton-evans.com/product/overview-of-the-2024-2026-u-s-transmission-and-distribution-equipment-market-high-voltage-series/ . The complete 2024-2026 series is priced at $1,450.00, with individual 3–5-page report summaries available for $195 per market overview. Each report provides product/system/component definitions, revenue estimates of key suppliers, overall market segment size, market share assessments, outlook through 2026, and revenue split between sales to utilities and commercial-industrial buyers.
Detailed information including shipment estimates, key market participants and market trends are included in the actual market overviews. We will provide highlights of additional HV equipment types for our website visitors within a few weeks. Following are the HV equipment/system topics for this month: FACTS: A Flexible Alternating Current Transmission System (FACTS) is a system composed of static equipment used for the AC transmission of electrical energy. It is meant to enhance controllability and increase power transfer capability of the network. It is generally a power electronics-based system. According to GE Vernova, FACTS provides the ability to deliver reactive power support, enhance controllability, improve stability and increase power transfer capability of AC transmission systems.
IEEE definition for FACTS: “a power electronic based system and other static equipment that provide control of one or more AC transmission system parameters to enhance controllability and increase power transfer capability.”
Siemens Energy indicates that FACTS improves transmission quality and efficiency of power transmission by supplying inductive or reactive power to the grid. According to Hitachi Energy, FACTS consists of three technology branches: series compensation, dynamic shunt compensation, and dynamic energy storage. The most common form of leading reactive power compensation (RPC) is by connecting shunt capacitors to the line.
Major categories of FACTS offerings include the following: Fixed Series Compensation (FSC), Static Compensation (STATCOM), Static Frequency Converters (SFC), Static VAR Compensation (SVC), and Thyristor Controlled Series Compensation (TCSC)
In one recent Newton-Evans study, the following information was developed from survey information gathered from about 30 power generation/transmission facilities. • Usage of FACTS: Requested information on whether or not the respondent was using any FACTS devices. Forty percent of participants reported some use of FACTS. • FACTS devices in use: For FACTS user sites, respondents were requested to indicate which FACTS devices/approaches were being used. SVC was in use at 75% of FACTS sites, while STATCOM was reported as in use by about 60% of the sub-group of FACTS users.
One 2024 CAISO report listed the estimated cost for an SVC unit at $20-30 million for an EHV project in California.
Separately, a precursor form of FACTS can be found in the ongoing usage of older synchronous condenser technology. In addition to the FACTS market sizing estimates shown in the FACTS market overview report, synchronous condenser sales estimates in the U.S. are also provided. Condensers are treated separately as the drivers for that technology is found in large fossil plant shutdowns, erosion of spinning reserves, lack of grid forming devices, as well as in use to counter the impact of renewables on grid stability.
Leading supplier of FACTS and RPC in the United States include HITACHI ENERGY, GE VERNOVA, SIEMENS ENERGY AND MEPPI.HVDC System: A High Voltage, Direct Current (HVDC) electric power transmission system uses direct current for the bulk transmission of electrical power, in contrast with the more common alternating current systems. For long-distance transmission, HVDC systems may be less expensive and suffer lower electrical losses. For underwater power cables, HVDC avoids the heavy currents required to charge and discharge the cable capacitance each cycle. Two main cost components are the converter stations and the cable.
The Brattle Group has prepared an excellent guide and tutorial, “The Operational and Market Benefits of HVDC to System Operators.” This guide is available to download courtesy of the American Council on Renewable Energy (ACORE) at https://acore.org/wp-content/uploads/2023/09/The-Operational-and-Market-Benefits-of-HVDC-to-System-Operators.pdf
Normally manufacturers such as those identified above do not state specific cost information of a particular project since this is a commercial matter between the manufacturer and the client, which, in the case of HVDC projects, is usually a non-utility corporation/LLC that is set up specifically for managing the HVDC project.
HVDC project costs vary widely depending on the specifics of the project such as power rating, circuit length, overhead vs. underground/underwater route, land costs, and AC network improvements required at either terminal. A detailed evaluation of DC vs. AC cost may be required where there is no clear technical advantage to DC alone and only economics drives the selection. Typically, the longer the transmission route, the more cost-effective can be HVDC.
There are a handful of HVDC U.S.-based projects either about to get underway or planned for construction during 2025-2026. Several more remain on the drawing board awaiting the required routing approvals and funding from multiple parties. Each project we have found is estimated to cost well over one billion dollars. Only a portion of that total project cost will be awarded to one of more of the above-listed firms for HVDC converter stations. However, each award to the above suppliers will be worth multiple millions of dollars.
Since the earlier 2021-2023 edition of this report, three projects have been cancelled/postponed indefinitely. These include Plains and Eastern Clean Energy Link; Rock Island Clean Line and Juan de Fuca Cable HVDC. The current U.S. HVDC projects underway, about to begin, or still in the pipeline of possibilities includes a total of eight named projects that Newton-Evans has uncovered. Together, these announced projects are valued at around $50 billion level of investment. Hitachi Energy, Siemens Energy and GE Vernova are the key suppliers of HVDC in the U.S.
Air-Insulated Substations: There are three categories of Air insulated (AI) Substation EPC providers. These include: (1) the HV and MV equipment manufacturers offering EPC services, (2) Top tier EPC firms, and (3) second tier EPC firms. These EPC firms provide total “turn-key” substation design, engineering and construction services. When manufacturers are awarded AI substation awards, they most often will utilize their own equipment wherever plausible. EPC firms tend to specify and integrate substation equipment from multiple suppliers. Tier One EPC firms typically construct large HV substations while Tier Two and smaller EPC firms specialized in MV substations. Internationally, large HV/MV equipment manufacturers account for a higher share of turn-key EPC activities for greenfield substation projects than they do in North America. A more recent addition to the global need for small substation construction for mid-size renewables operations has meant an increase in the number of available substation construction firms able and willing to work in remote areas of the United States.
Based on NERC projections, there are plans to add about 18,675 miles of HV transmission lines over the 2021-2030 decade. All of this expansion will be at 100kV or higher. This in turn impacts substation design and build costs. Nearly 300 transmission substations will be constructed (or uprated) to accommodate these new line additions. Source: https://www.nerc.com/pa/RAPA/ra/Reliability%20Assessments%20DL/NERC_LTRA_2023.pdf
Costs for AIS substation engineering, procurement and construction activities are unique to each substation project. In the U.S. market, our estimates range from a low of $7-10 million for some MV substations – and even a bit lower for construction of smaller substations at remote renewable sites, to a high of more than $80-200 million for HV/EHV substations. UHV substations, already in progress internationally, may cost upwards of $500 million.
IOUs, G&Ts and Federal Sites are most closely identified with HV substation construction plans, while distribution cooperatives, municipal and other public power operations and industrial sites indicated primary involvement with MV substation construction plans. Merchant plants for this report are most often associated with construction of MV substations for renewables farm/park sites.
Reliability and congestion relief have been cited by NERC as the two principal drivers for new transmission line construction. Siting and permitting are the two obstacles that continue to plague more rapid development of transmission capacity.
A Gas Insulated Substation (GIS) is an electric power substation in which all live equipment and busbars are housed in grounded metal enclosures sealed and filled with sulfur hexafluoride gas. Also defined by the U.S. DOE as an integrally constructed substation in which all the apparatus units (circuit breakers, disconnect switches, current and voltage transformers, and surge arresters) are isolated from air in metal tanks filled with sulfur hexafluoride (SF-6) gas. EPC firms play a key role in the HV GIS substation market as the majority of GIS-using utilities continue to outsource engineering, procurement and construction activities to EPC firms or to the EPC subsidiaries of large GIS manufacturers.
We have defined three categories of gas insulated substation EPC providers. These include (1) the HV and MV GI equipment manufacturers offering EPC services, (2) Top tier EPC firms, and (3) second tier EPC firms. These firms provide total “turn-key” substation design, engineering and construction services. When manufacturers are awarded GIS substation awards, they most often will utilize their own equipment wherever plausible (e.g., Siemens EPC contract for large HV GIS substations are with State of New Jersey). Tier One and Tier Two EPC firms tend to specify and utilize substation equipment from multiple suppliers. Tier One EPC firms typically construct large HV GIS substations while Tier Two and smaller EPC firms specialize in MV GIS substations. Internationally, large HV/MV equipment manufacturers account for a higher share of turn-key EPC activities for greenfield substation projects- both GIS and AIS types.
More than one-half of the respondents (55%) in a recent Newton-Evans’ study indicated they were considering turnkey approaches for civil and construction work, while major equipment would be furnished by the company through separate supplier agreements. Forty-two percent were considering full or partially engineered packages from EPCs and 29% directly from suppliers. Nearly one-third of the respondents were considering complete turn-key approaches for at least one or more projects.
Sources: Newton-Evans Research Company (HV GIS construction site visits and meetings with multiple GIS-related EPCs), along with data on BPA, Siemens, Hitachi Energy, HICO websites.
Observed turnkey prices for U.S. gas insulated substations over the past few years have ranged from $8 Million to $125 Million among the few publicized awards that have been publicly disclosed indicating a project price. The estimated total 2023 expenditures for EPC-related work (except for gas-insulated switchgear) and outlook through 2026 is provided in the market overview. The total U.S. market value of all substation construction activities for both greenfield and brownfield projects was likely approaching $n Billion in 2023 in “hard dollar” expenditures (for siting, construction, equipment costs) by electric utilities and industrial/commercial firms. As utilities around the world increasingly adopt a “green” attitude toward the environment, there has been a desire for non-SF6 alternatives to GIS developments. Up until about 2020, the highest voltage level non-sf6 GIS switchgear was about 145kV. By year-end 2025, we believe almost all HV and EHV voltage ranges will be available. Complete GIS configurations that will successfully operate with either non-SF6 gas mixtures or use clean air/vacuum technology for HV breakers will be offered by major GIS market participants.
The 2024-2026 edition of Market Overview for Substation Automation includes 14 topical reports on modern substation components. This month’s article presents some highlights from 7 more of these market overview reports. In May, we provided another seven summaries of modern substation components. Read the article that follows below this article for that information.
More information on the entire 14-report series of substation automation components can be found here: https://www.newton-evans.com/product/overview-of-the-2024-2026-u-s-transmission-and-distribution-equipment-market-substation-automation-series/. The complete 2024-2026 series is priced at $1,450.00, with individual 3-5 page report summaries available for $195 per report. Each report provides component definitions, revenue estimates of key suppliers, market share assessments, outlook through 2026, and revenue split between sales to utilities and commercial-industrial buyers.
Sequence of Events Recorders: A sequence of events recorder (SER) is an intelligent standalone microprocessor-based system, which monitors external inputs and records the time and sequence of the changes occurring with any substation activities. Sequence of events recorders usually have an external time source such as a GPS or radio clock configured with Precision Time Protocol (PTP). When wired inputs change state, the time and state of each change is recorded.
Our shorter definition is: a sequence of events recorder is a microprocessor module within the electric power substation that logs time-stamped events. The SER functions can also be performed by other smart substation devices such as multi-function meters and recorders.
The total utility substation market for dedicated, stand-alone SOE/SER units is in decline due to the inclusion of SOE/SER functionality in other smart substation devices and systems. However, the decline among utility users is being offset by the application of SOE/SER devices among non-utility DER asset owners and operators, hence our outlook is for low-to-moderate growth over the mid-term years. See report SA08 for detailed information.
Power Quality Recorders: A power quality recorder (PQR) is a microprocessor module that most often is located within the substation that provides and enables regulatory power quality application, measurement, comparison, and profiling of power quality parameters at the individual electrical system interfaces: (e.g. generation, transmission, sub-transmission and distribution system levels). Source: Siemens Corporation. Substation-based PQ recorder sales have plateaued in recent years as single functions (like recording) tend to become one function of a multi-functional “system-like” instrument. Non-utility DER assets will likely procure power quality monitors to track power quality being produced by their generation assets prior to uploading to transmission lines. It is difficult to separate out specific units that ONLY perform power quality recording, so the authors are attempting to allocate costs back to the specific PQ function being studied. See report SA 09 for detailed information.
Reclosers: An Automatic Circuit Recloser (ACR) is a medium voltage circuit breaker equipped with a mechanism that can automatically close the breaker after it has been opened due to a fault. The market size estimates below include 1phase and 3phase hydraulic units, which category continues to represent as much as 17%-24% of the total recloser business in the U.S. Key factors influencing demand include:
Aging and obsolescence of installed base of older reclosers
Regulatory decisions on reliability improvements mandated
DMS installations and growth in DA activities will likely spur additional ACR installations
Utilities represent the bulk of the recloser market – 90%+ of total demand. Substations using recloser technology typically will have four units installed.
Customer density and feeder length both affect system protection choices (reclosers versus fuses or sectionalizers).
Ease of installation, maintenance-free operation, visual break and SCADA connectivity
See report SA10 for detailed information.
Substation Communications devices include Ethernet switches, hardened routers, teleprotection comms equipment, serial device servers and media converters. Key U.S. market participants in this multi-hundred million dollar market include CISCO, SEL, Siemens, Belden, GE Vernova, ABB and Hitachi Energy, along with many other suppliers of these devices. See SA12 for details on this market.
Voltage Regulators: A voltage regulator (VR) is an electrical device designed to automatically maintain (regulate) a constant voltage level. VRs may use an electromechanical mechanism, or passive or active electronic components. Depending on the design, it may be used to regulate one or more AC or DC voltages. This overview provides information only on substation-based single and three phase VR units. The larger portion (60-70%) of the total VR market is for single phase units placed along MV feeder paths. In both applications, VRs are often paired with power capacitors
Electric utilities also use mechanical automated units (AVRs) to adjust voltage levels as loads fluctuate on each feeder in an MV distribution network. MV AVRs are basically transformers with multiple taps used to change the turns ratio and thereby alter output voltage. A voltage regulator may be a simple “feed-forward” design or may include negative feedbackcontrolloops. It may use an electromechanical mechanism, or electronic components. Depending on the design, it may be used to regulate one or more AC or DC voltages.
In an electric power distribution system, voltage regulators may be installed at a substation (1p/3p) or along distribution lines (1p) so that all customers receive steady voltage independent of how much power is drawn from the line. The DA portion of the VR market is primarily for automated control of single-phase units installed along MV distribution lines. See report SA13 for detailed information on the substation voltage regulator market.
Substation Timing Synchronization Devices/Clocks: Special clocks used for precise timing indications for improving grid reliability, gaining a better understanding of the power system operation, predicting and preventing systems-wide faults, and testing and verifying operation of protective devices. (Source: http://www.arbiter.com/news/technology.php?id=4)
Similar to the findings obtained from equipment manufacturers in a major Newton-Evans study of timing synchronization, IRIG-B was the most frequently mentioned timing reference used by
U.S. utilities as recently as 2014, as cited by 87% of a survey sample comprised of 30 US electric power utilities. NTP (37%) and direct GPS signals (30%) were mentioned as the next most important references. IRIG-B continues to be widely used in mid-2024.
In that same referenced Newton-Evans study, 21% indicated that their utility would be specifying Precision Timing Protocol (PTP) Standard IEEE 1588 within five years for use as the substation timing references. One utility had already begun standardizing on the PTP standard. Importantly, as American utilities migrate to IEC 61850, time synchronization becomes ever more critical to reliable operations. Much of the increase in demand for timing synchronization devices is a result of the proliferation of synchrophasor measurement units across North America. The North American Synchrophasor Initiative (NASPI) provides a great deal of information on their website here https://www.naspi.org/ .
More than 80% of US utilities have recently indicated that they rely on a stand-alone clock for embedded GPS. The utility industry’s migration to Ethernet and IP-based telecommunications to/from substations will likely include a changeover from “legacy” approaches (typified by IRIG- B) to IEEE-1588 to enable more precise network monitoring and sequence of events recording. See report SA14 for details.
Substation Automation Integration Specialists are firms (or corporate business units) that can assist with or provide a full or partially automated substation on a turnkey basis. Such firms include dedicated businesses such as listed in the SA platforms report SA03 (NovaTech, SEL Automation Services, Subnet Solutions, Eaton-Cybectec), or can be business units of larger companies engaged in the electric power automation business as EMS/SCADA suppliers, RTU manufacturers or protection and control specialists.
Three “tiers” of substation integration providers are included in our assessment:
SCADA /P&C industry participants with substation devices (RTUs, FEPs, Relays, IEDs, platforms) offering substation integration expertise
T&D Engineering Services firms with substation integration expertise
See report SA11 for information that describes the substation automation integration specialist companies in each tier along with revenue estimates for each tier.
We hope you enjoy reading this summary of market information on substation components. In July, we will provide readers with part one of a two-part series describing high voltage substation equipment as used in the United States.
The 2024-2026 edition of Market Overview for Substation Automation includes 14 topical reports on modern substation components. This month’s article presents some highlights from 7 of these reports. In June, we will provide another seven summaries of modern substation components.
More information on the 14-report series of substation automation components can be found here: https://www.newton-evans.com/product/overview-of-the-2024-2026-u-s-transmission-and-distribution-equipment-market-substation-automation-series/. The complete 2024-2026 series is priced at $1,450.00, with individual 3-5 page report summaries available for $195 per report. Each report provides component definitions, revenue estimates of key suppliers, market share assessments, outlook through 2026, and revenue split between sales to utilities and commercial-industrial buyers.
Remote Terminal Units: A Remote Terminal Unit is a microprocessor-controlled electronic device that interfaces objects in the physical world to a distributed control system or to SCADA by transmitting telemetry data to the system from substation-based RTUs and pole-top- installations, and by using messages from the supervisory system to control connected objects. RTUs are evolving into substation gateways, controllers and servers, depending upon the manufacturer and the application/intended use. See the separate report on substation automation platforms – (SA01 in this series).
Programmable Logic Controllers (PLCs) are microprocessor-based devices used to control industrial processes or machines. They provide advanced functions, including analog monitoring, control and high-speed motion control as well as share data over communication networks. During the 1980s and 1990s, hundreds of units were sold annually for use in electric power substations, led by Schneider’s Modicon and Allen-Bradley. Programs to control machine operation are typically stored in battery-backed or non-volatile memory. A PLC is an example of a hardened real time system since output results must be produced in response to input conditions within a bounded time, otherwise unintended operation will likely result.
PLCs are designed for multiple inputs and output arrangements, extended temperature ranges, immunity to electrical noise, and resistance to vibration and impact. Programs to control machine operation are typically stored in battery-backed or non-volatile memory. A PLC is an example of a hardened real-time system since output results must be produced in response to input conditions within a bounded time-frame, otherwise unintended equipment operation will/may result. SA02 in this series.
Substation Automation Platforms: A substation automation platform is a substation-resident computing platform that includes some sort of hardware architecture and a software framework (including application frameworks) that may better classify the platform as a gateway, an automation controller or a data concentrator. A single programmable automation platform can perform an expanding array of communications, automation, control and cyber security functions in the electric utility substation.
SEL’s RTAC and 2032 units are quite strongly represented as of mid-year 2024, especially in mid- size cooperatives and municipal utilities. Together with NovaTech’s ORION along with Eaton’s Cybectec and GE’s older D400 (now replaced with the G100/G500 offerings) have been long- term participants in development and provision of substation automation platforms. These four firms accounted for nearly three-quarters of the 2023 market. The larger global firms are also active as noted in the table below. Note that substation platform providers may also provide complete substation modernization consulting and engineering services and can provide project management for large automation/modernization projects. Note too that some feature-rich, smart RTU equipment also serve as substation automation platforms. Revenue for these advanced RTUs is not included here. Newton-Evans estimates for substation automation platform sales in 2024 were in the $125-175 million range. SA03 in this series.
Multifunction Meters and Recorders: Substation Multifunction Meters, Panel Meters and Recorders are units that can display substation data locally and/or transmit substation data back via RTU or SS controllers and platforms to SCADA and energy management systems. Panel meter sales had plateaued by the early 2000’s, as the functionality of these meters could by then be duplicated by digital relays. However, due to cyber security issues, operational complexity and visualization issues, panel meters are making somewhat of a comeback and finding their niche support base growing once again. Measurements of energy consumption and power quality are among the key attributes of leading multifunction meters and recorders. Waveform capture, harmonics, and alarm limits are also recorded in advanced multifunction meters and recorders. I/O capabilities are provided in these devices for communicating with SCADA and related energy monitoring systems. Newton-Evans estimates for sales of multifunction meters and recorders 2024 are in the $65-90 million range. See SA04 for more information on meters and recorders.
Substation Inter-Utility Revenue Meters are metering products capable of collecting and storing incoming and outgoing substation power flows by performing various measurements. The devices are sold in the low thousands of units annually. As the role of distributed generation resources increases across the U.S., there will likely be a need for additional inter- utility and DER provider-to-utility revenue meters. See SA05 for more information.
Digital Protective Relays: A digital protective relay uses a microcontroller with software-based protection algorithms for the detection of electrical faults. Such relays are also termed as microprocessor type protective relays. As renewable energy sources grow in importance, the need will grow for system protection and control for solar, wind, and other renewable energy installations. New relay designs or adaptations of existing protective relays will be developed to meet the requirements for thousands of DER applications during the remaining years of the 2020’s. There are opportunities for protective relay managers to work directly with renewable systems developers (such as Pure Power Engineering, Trimark, among several others).
The Hubbell acquisitions of RFL Electric just a few years ago, and more recently, the company’s acquisition of Beckwith Electric are harbingers of additional acquisitions of existing smaller independent relay manufacturers likely to occur over the mid-term. These will likely include international manufacturers in the mix. See report SA06 for more information.
Digital Fault Recorders: A digital fault recorder is a microprocessor device level module installed within the substation (or industrial location) that records electric power faults. DFRs are more capable than are power disturbance monitors, which also provide some level of information on electric power faults. Disturbance monitoring equipment (DME) tend to be lower-cost and easier to install and use than are DFRs. DME also provide information on several power fault components and can be used for some root cause analyses. Special purpose, dedicated DFR units tend to have performance features and capabilities that go beyond the increasingly popular relay-centric approach to fault recording. This portion of the DFR market was about $30-$40 million as of 2021. Relays are increasingly being used to provide basic fault recording and sequence of events recording functions as a lower-cost alternative for fully-featured DFRs from the leading U.S. providers. Perhaps $15-25 million of relays applied to this function.
Newton-Evans believes that there will be some level of growth in use of dedicated DFR technology due to the continued deployment of synchrophasor technology across the United States. As well, the increasing demands from regulatory authorities for precise electric power fault information and root cause analysis will affect the increase in use of DFRs and related equipment (including IEEE 1588-compliant clocks). See report SA07 for more information.
Be sure to check in with our site next month for coverage of another seven components of modern digital substations.
Newton-Evans Research has been assessing the increase in demand for power transformers of all size ranges since the COVID pandemic. Many observers have focused on the growth of the data center and artificial intelligence market as being the principal driver for this increase in demand. Additionally, there are equally important – but somewhat less impactful – market drivers that are also increasing the demand for power transformers.
The Trump administration’s dual focus on expanding mining operations and reshoring of manufacturing, the Biden administration’s prior push on increasing U.S.-based semiconductor fabrication operations and its earlier focus on clean hydrogen production, are each adding to the increase in demand for power transformers. Add to this the typical utility-driven demand to replace hundreds of aged-out large power transformers annually and one can see the demand for medium and large power transformers being likely to continue over the short-term and medium-term economic cycles – likely through 2030.
The recent administration decision to apply tariffs to imported finished goods of all types and the duties planned to be applied to commodities and key components of electrical equipment could certainly put a damper on at least part of the planned increase in demand for large power transformers. Commodity price increases, especially for electrical steel and for copper, coupled with the surge in demand from utilities and the C&I community, have necessitated that such costs be passed along to the buyer. See Table 1 for a look at the significant price increases for these two key components from January, 2019 to April, 2025.
FIGURE 1.
So, the question before us is this: How do we shorten the lead time between order placement and scheduled delivery of a medium to large power transformer? Certainly, development of additional manufacturing facilities and expansion of existing factories is going to help. Figure 2 lists the known plans among transformer manufacturers to expand existing manufacturing facilities or to construct new facilities in the United States over the next 12-36 months. This new capacity will help shorten the currently extensive lead times between order placement and delivery of power transformers. There are 20 transformer manufacturers on our list of known sites planned for expansion or new facility construction spread over 11 states across the U.S. Seven of the listed suppliers are expanding power transformer production capacity. Nearly 3,000 manufacturing and support positions are being added among this group (which is likely not all-encompassing).
FIGURE 2.
If the IEEE PES, NEMA and others could form a task force to standardize on design and performance characteristics to a reasonable extent for large power transformers, that would also help shorten unit production times. A recent article from Wood-Mackenzie focused on the efforts of U.S. mining companies now seeking to mine extensively for copper, given the high level of demand for power and distribution transformers. (3)
In Figure 3 below, I have attempted to scale perceived unit demand and supply capacity through 2030. Note that relative current imbalance between power transformer supply (orange line) and demand (blue line). The third line (grey line) indicates the view that the increased unit production capacity will have a positive effect on closing the multi-year gap between power transformer order placement and shipment of completed units. FIGURE 3.
Next month, we will address the distribution transformer industry segment and look at what will likely shape up as a somewhat similar supply-demand imbalance curve, and the time lags affecting deliveries. We will separate pole-mount and pad-mount data as best as we can.
In the meantime, our Market Overview series on Power and Distribution Transformers provides up-to-date coverage on 14 transformer-related topics. Purchasers of this series will be provided with a complimentary update in the third quarter 2025. More information can be found at https://www.newton-evans.com/product/overview-of-the-2024-2026-u-s-transmission-and-distribution-equipment-market-transformer-series/ ,
The Newton-Evans Research Company is pleased to announce a new, cost-efficient purchasing option for its extensive series of electric power T&D (Transmission and Distribution) equipment, systems, and services market overviews. Now Available: All 86 Report Summaries for $7,500 This special package includes every summary from our seven major report groupings, as well as an exclusive June 2025 Market Update. The update will analyze the impact of newly imposed or revised U.S. tariffs on T&D equipment and includes an updated spending outlook through 2027.
What’s Included: Each market overview provides: • A technical description of the specific product, system, or service • A list of key market participants • Market size and share estimates • A market outlook through 2026 • Sample pricing data (for most topics) Report Categories (2024–2026 Updates):
Our 86 individual topic reports span seven major categories:
High Voltage Equipment
Medium Voltage Equipment
Power and Distribution Transformers
Control Systems
Distribution Automation
Substation Automation
Protection & Control Each category includes between 8 and 18 individual research topics. For category details and topic descriptions, please visit our Reports page: www.newton-evans.com/our-reports This is the only series of its kind—a vital resource for professionals who need to know the key players, current trends, and future projections in the electric power sector.
Some readers may be unaware that the Agency for International Development (USAID) has planned, developed, managed and executed successful electric power infrastructure development projects in dozens of developing nations over its multi-decade history. USAID had been the world’s premier international development agency, until its near-closure early this year. USAID has been one of three principal approaches to the country’s being held in high regard among other nations, along with Voice of America and the Peace Corps. Begun under President John Kennedy, the Agency for International Development was an outreach that expanded upon Kennedy’s famous statement “Ask not what your country can do for you, but what you can do for your country.” Kennedy’s outlook further expanded to a world view in the context of “…what can America provide to benefit the world.” The nation was energetic and young people stepped up to respond and to propel the country forward on a number of fronts.
The first contact with USAID in my experience was in Vietnam some 58 years ago. I was a young U.S. army specialist/sergeant deployed in villages around and downriver from Saigon. On multiple occasions I would come across USAID truck convoys delivering foodstuffs (including rice, of all things, a somewhat unbelievable commodity to those of us who could see Vietnamese rice paddies just about everywhere in that region of the country) in large sacks that read “From the American People.” A nice sentiment that meant a lot to the nearly three million servicemen and women who served in that conflict and could find something positive in their collective experience via US AID and its courageous efforts to feed many thousands of South Vietnamese citizens.
The U.S. Agency for International Development (USAID) has remained as the principal U.S. agency to extend assistance to countries recovering from disaster, trying to escape poverty, and engaging in democratic reforms. In addition to the provision of foodstuffs and life-saving vaccinations against diseases to millions of people, electrification projects rank among USAID’s many successful undertakings.
USAID supports electrification projects globally, focusing on expanding access to reliable and affordable electricity, particularly in off-grid areas, and promoting sustainable energy solutions, including mini-grids and solar systems.
USAID’s key focus has included these five areas: Expanding Access to Electricity: USAID aimed to increase access to electricity, especially in underserved areas, by supporting on- and off-grid solutions.
Strengthening Energy Sector Institutions: USAID worked to strengthen the capacity of energy sector institutions to manage and deliver electricity services effectively.
Promoting Private Sector Investment: USAID encouraged private sector involvement in the energy sector to foster sustainable and scalable solutions.
Developing Sustainable Off-Grid Models: USAID supported the development of viable and sustainable off-grid electrification models, including mini-grids and solar systems.
Supporting Clean Energy Technologies: In partnership with the National Renewable Energy Laboratory, USAID has developed ongoing and successful renewable energy programs in at least 13 countries representing nearly one billion people.
Now the real point of this article is simply to make readers aware of the multiple electrification projects that have been successfully undertaken by USAID over the years. Please let your legislators know that it is a mistake to forego these positive developments that cast a bright and positive light on America helping other nations improve access to electricity and thereby putting our country in a good position to win friends and influence governments around the world. If we can’t continue to help our international brothers and sisters, then surely our frenemies will step in and cheer our departure from this charitable component of the American nation on the world scene.
Here is a key example of some remarkable electrification successes attributable to wise research, planning and investment decisions made by USAID management and staff over the past 63 years.
Ukraine: USAID had been helping Ukraine strengthen its power grid, improve energy efficiency, and increase the use of renewable energy sources. Papua New Guinea: USAID supported the PNG government in its efforts to expand electricity access, with a focus on off-grid solutions and private sector engagement.
South Asia: USAID had been working with countries in South Asia to support their energy sector transformation, including the development of renewable energy and the improvement of energy efficiency.
These efforts have benefited many of the citizens in these and at least a dozen other countries with basic electrification to remote areas, infrastructure electrification of transit and transport systems, upgrading of power lines and substations, and a more positive view of America and Americans. This is one vital approach to keep the U.S. influential and strong among global communities. This is a display of soft power at its finest. Andrew Natsios had served as USAID administrator under President George W. Bush. He recently stated, “USAID is the most pro-business and pro-market of all aid agencies in the world.”
Nonetheless, as I write this article, the administration has apparently concluded its review of USAID, and indicated that just about all of USAID’s programs would be cancelled, involving approximately 5,200 contracts. We who are active participants in the energy industry need to raise our voices in support of USAID and its role in expanding American influence and winning friends for the nation around the world. At the same time, it is important for us to realize that the Voice of America has been another strong component of our foreign policy since the early days of World War II. News of energy developments in the U.S. and worldwide have been among the news stories broadcast over the VOA throughout these last eight decades. While traveling to nearly 135 countries during my own active energy industry research studies over 45 years, I have been made aware of VOA broadcasts listened to by energy industry colleagues in languages ranging from Farsi and Arabic, to Russian, to Chinese and a host of other languages. In some countries, VOA is the only way for citizens to learn about American efforts and progress in sustainable development and obtain a glimpse of world news. VOA has served the world with a consistent message of truth, hope and inspiration. I can vouch for the VOA’s influence on the world community of nations based on my own experiences and travels in countries like Iran, China and Russia as well as much of Asia.
If our Congressional representatives and senators lack the will to raise their voices, then we must rise to do so. Adding the budgets of USAID and VOA together, the total allotment amounts to less than one percent of the federal budget. USAID is looked to by more than a million people around the world involved in sustainable development goals as well as multiple millions who have benefited from an array of successful energy initiatives now fully implemented.
Overview of the 2024-2026 U.S. Transmission and Distribution Equipment Market: Protective Relay Series. The first report grouping is the completion of our final series in the 2024-2026 suite of U.S. T&D-related market overviews covering more than 85 individual topics in seven series. Our newest series launched this week is the complete set of eight individual market snapshots for topics that includes a variety of protective relays used for distribution feeders, generators, motor control, other substation relays, electro-mechanical relays, drop-in control houses, synchrophasors and teleprotection.
Individual market snapshots on these topics are priced at $195.00 while the complete set of protective relay market overviews is available for $1,250.00. More information about the protection and control market overviews can be found on our website.
The six other components of the Market Overview suite for 2024-2026 include: Transformers, Distribution Automation, MV Equipment, Substation Automation, HV Equipment and OT/IT Systems. In all, more than 85 individual T&D-related market snapshots of equipment, systems and services are included.
Study of Protective Relays and IEC 61850 Adoption. The second report announcement is for a special study undertaken in the October 2024-January 2025 period that addresses topics centering on the adoption of IEC 61850 and trends for protective relaying practices in North American utilities. A total of 27 utilities participated in one or more topics with 24 respondents, including eight IOUs, completing the entire survey of 20 technical questions. Our assessment of the findings is provided along with appropriate graphs and tables. The report is priced at $495.00 and is available for online ordering.
On November 21, McKinsey & Company hosted an outstanding and timely webcast entitled Powering AI: Opportunities in Data Centers. If you have any involvement with data centers from a utility perspective or are involved with data center design, development, consulting or are simply interested in one of the booming sectors for power transformers and T&D equipment, you may want to spend an hour sitting in on this excellent webcast. The link is here: https://app.events.ringcentral.com/events/powering-ai-opportunities-in-data-centers-1966f3dd-0fb8-48ff-8093-1856433d6363/replay/UmVjb3JkaW5nVXBsb2FkOjI4MjI1
It seems to me that after a couple of months spent delving into the current situation regarding the impact of data centers on utilities and on transformer and other T&D equipment needs, both those in the U.S. and others around the world, there are a number of obstacles facing utilities that will also resonate with plans being made by data center owners and investors. The ongoing development of AI will lead to more numerous and more robust (hyper-scale) data centers being planned and constructed over the next five years.
However, the electricity markets in developed nations have built out and operate currently reliable supporting electric power infrastructure to meet recent demand levels. In many countries wherein only modest growth in power consumption is occurring, the available supply of electric power may not match up well with the growing power demands of data centers. In economic terms, the demand and supply curves are not in synch at this time, at least not at first glance, nor do they appear to line up any time soon. As a result, interesting work-arounds are being developed.
A range of options is available to meet the expected increases in power demand, and in the U.S., many utilities will need to increase the available supply of electricity through plant expansions, refurbishment or bring out of retirement some large fossil-fueled plants.
New power plants likely to be built in the near term to meet this rather sudden (in utility terms) huge increase in demand will be largely natural-gas fueled as these plants can be constructed and operating in a shorter time frame and at lower costs than can some larger renewables or other fossil-fueled projects. Recently, the Electric Power Research Institute (EPRI) stated that data centers may account for as much as 9% of power generation in the U.S. by 2030. Boston Consulting Group (BCG) has indicated power demand levels of well over 100 GW by 2030 may be reached.
Availability of electric power supply is only one part of the power equation needed to meet the upsurge in demand coming from AI developments and data centers. By looking at alternatives to today’s data center hubs, there are areas within the U.S. with more than sufficient power to meet current load requirements.
Permitting processes will have to be speeded up at the federal, regional, state and local levels while regulatory action must be taken to reduce obstacles to HV transmission development. During the 2020-2023 years, fewer than 400 new HV line miles have been annually added to the grid. Additional transmission assets must be developed. Transformer and other T&D equipment manufacturing capacity will need to be increased significantly. Training of a workforce that can support manufacturing is required, as is the need for developing capable data center operations personnel.
The data center-allied consortia recognize a near-term market need for their offerings and rightly want to seize on this opportunity. When searching for plausible sites, (as was voiced in the McKinsey webcast described above), companies are looking at secondary and tertiary regional locations – primarily heartland areas blessed with an abundance of power generation capacity to build new and very large data centers.
Today’s primary data center hubs around the world may be reaching capacity regarding electric power delivery capabilities and may have limited available infrastructure, so alternate site selection assessments are playing key roles for data center developers. Examples of secondary hubs in the U.S. include Chicago, Atlanta, Dallas and Phoenix, while Las Vegas, Reno and Columbus are considered examples of tertiary hubs at this time.
Today’s major U.S. data center owners/operators include subsidiaries of Amazon, Microsoft, Google and Meta along with Digital Realty and Equinox. Important locations (hubs) for very large data centers include Northern Virginia, home of the largest data center aggregation in the world, along with hubs in California and Texas and several other states.
As of November 2024, there are about 5,400 data centers operating in the United States alone. At least 380 new U.S.-sited data centers are being planned or being constructed at this time. Before these sites can become operational, large power transformers and high-voltage equipment must be purchased, manufactured, shipped, installed, tested and operational on the utility/energy provider side. A substation may have to be enlarged or a new substation built to serve the proposed data center.
The medium-voltage and low-voltage equipment used within the data center facility also has to be specified, purchased, installed and tested. Supply chain issues confront the utility-required equipment as well as the facility power equipment availability as manufacturer pipelines are somewhat clogged with the sheer volume of incoming orders, along with material sourcing issues, and in some cases, labor availability issues that can slow down production cycles and affect delivery times. Effect of Tariffs
If the incoming Trump administration does follow through on its promise to impose 25% tariffs on imports from our friends and neighbors in Canadian and Mexican power equipment manufacturing locations, that action will add significantly to equipment costs and delivery delays, especially for power transformers and other T&D equipment, as a good percentage of both are currently manufactured in either Canada or Mexico.
The rapid increased in AI-fueled demand for very large and hyper-scale data centers will also significantly impact electronic devices with a requirement for increased cooling and heating systems needed for new generations of semiconductor developments.
It seems to me that a good option to meet the near-term reliable power needs of data center planners is to include on-site renewables with battery energy storage systems in addition to their grid-connected primary source of utility-delivered electricity. Sort of a hybrid micro-grid to supplement grid-supplied power.
Looking across the American industrial base, we note that manufacturers and other industrial firms account for only 1,145,000 meters, serving about 450,000 industrial firms in the U.S. There are more than 19,360,000 commercial sites and the number of residential consumers will surpass 143 million meters in the next few months.
However, when it comes to consumption of electricity, residential use accounts for 38.4%U.S. of total usage, while commercial use stood at 35.4% and industrial use accounts for a significant 26% of the total. It is foreseeable that the percentage of power consumed by industrials will increase rapidly to account for perhaps one-third of the total electricity consumption by 2030. This will be due not only to the rapid growth of data centers, but likely to some degree of additional discrete and process manufacturing facilities being reshored as well as new factories coming online. SeeFigure1.In closing, it appears we will be in for a roller coaster of a ride, between the energy industry in transition, the need for more power capacity, and the explosive growth of not only data centers, now accompanied by a resurgence for high power requirements from a wave of new semiconductor fabrication plants, a likely strong expansion in mining industries, the reshoring of industrial firms, and a possible increase in several power hungry hydrogen production facilities now being designed for delivery during the next five years.
One of the questions asked in this year’s P&C survey concerned utility connections (if any) to distributed energy resources (DERs). As shown below, about 56% of respondents indicated having one or more interconnections to DER installations. Another one-third stated that they had no connections to DERs nor any plans for such connections. Eleven percent indicated that the utility plans to implement DER connections by 2026.
Another topic included in this year’s study was to learn more about the methods used, or planned for use, to detect high Impedance Faults (HIFs) on utility distribution systems. As noted in the accompanying table, nearly three quarters (73%) of respondents indicated reliance on customer notifications to detect HIFs. About one quarter (26%) cited the use or relays used in conjunction with HIF detection, while more than one half (53%) stated that the use of relays was a method under consideration for HIF detection. Thirteen percent reported using digital fault monitors, while another 27% were considering use of digital fault monitors. None of the respondents were using mechanical, pole-mounted HIF detectors at the time of the survey, but 20% were considering this method.
MARKET TRENDS DIGEST
News and updates on our ongoing research; summary reviews and highlights from completed studies

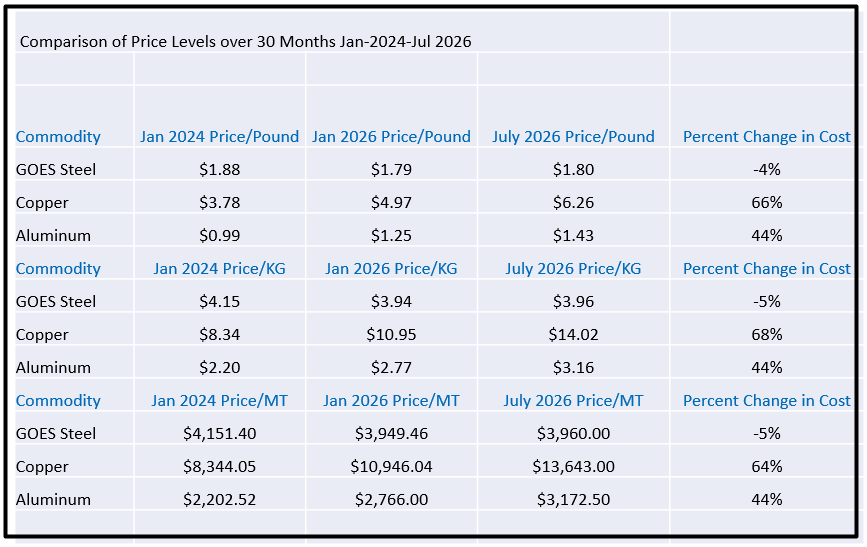
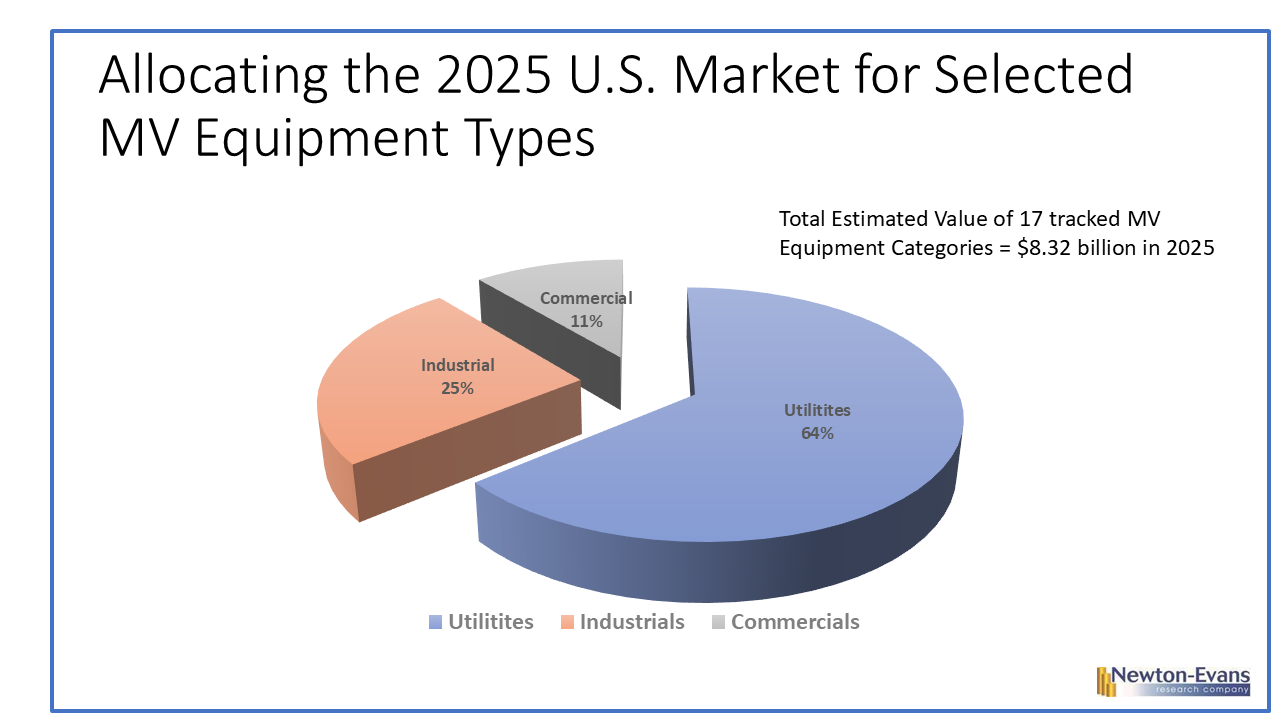
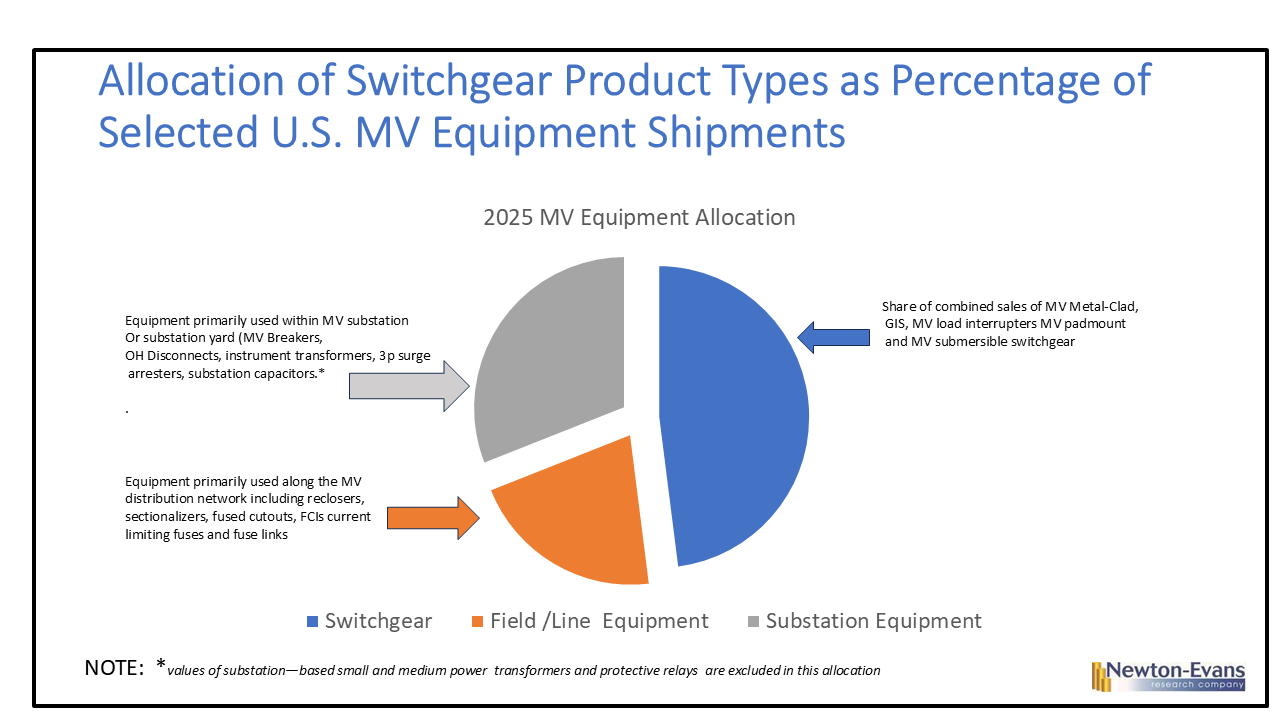
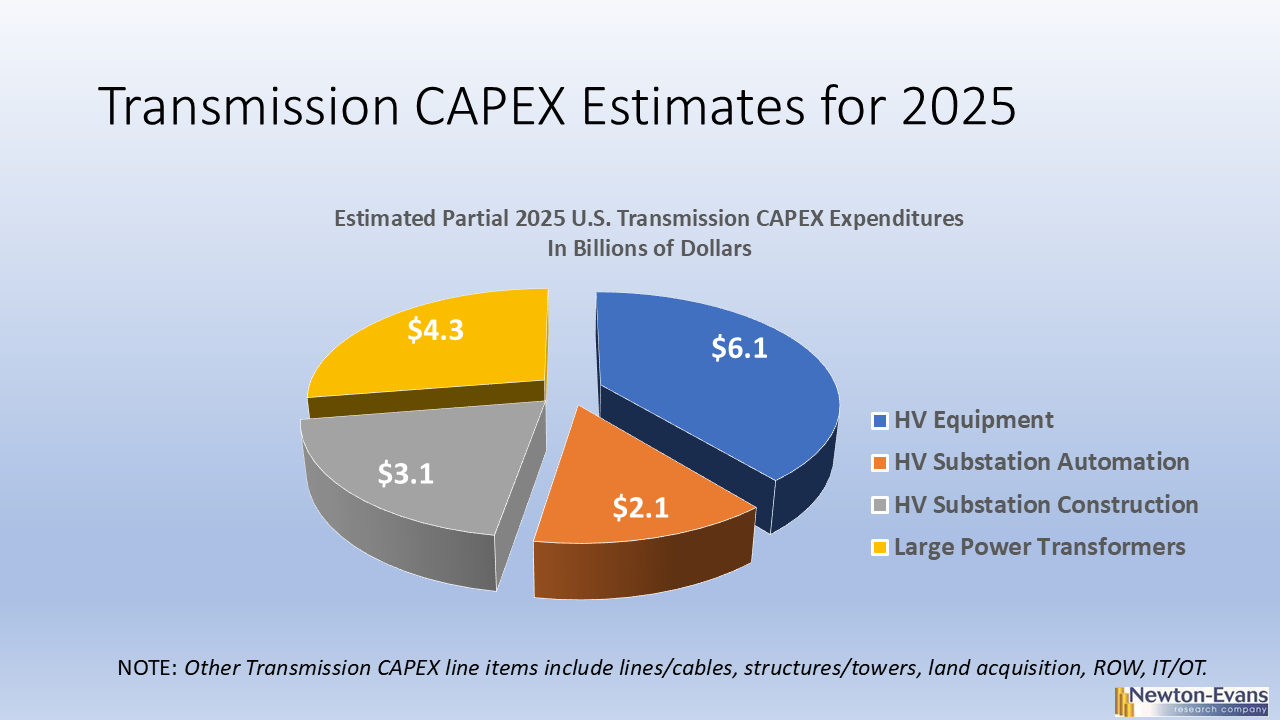
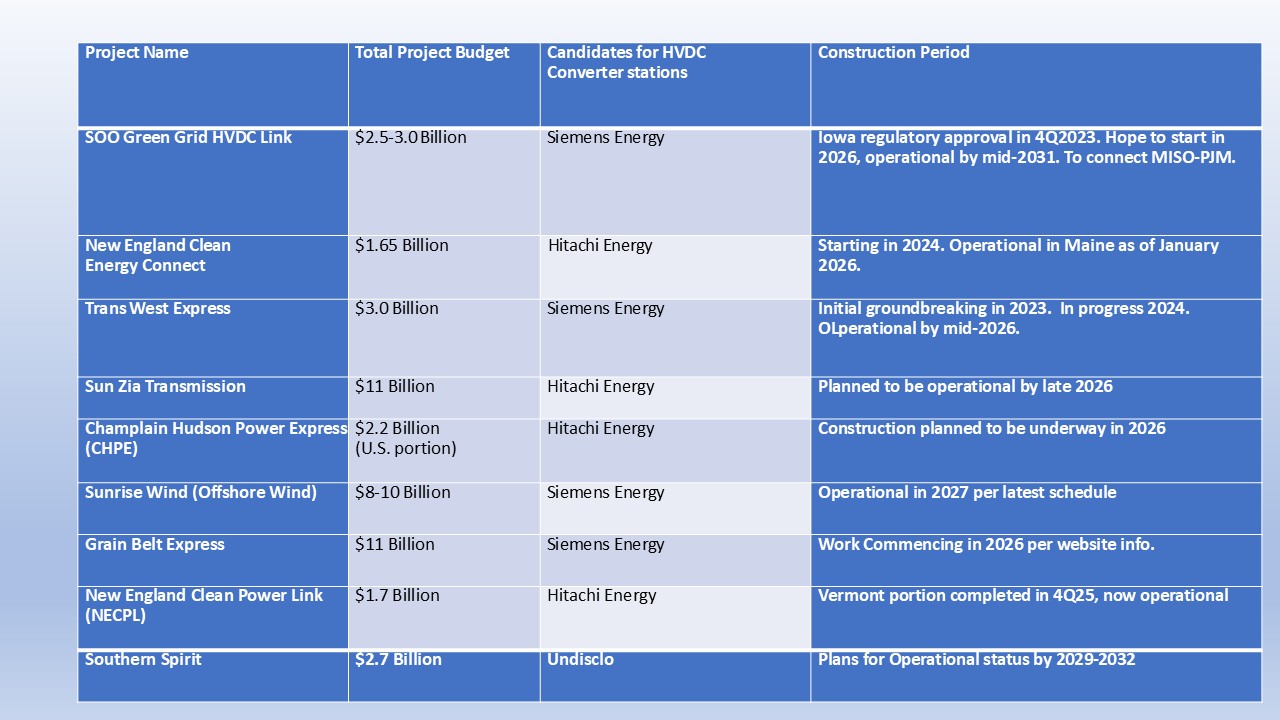

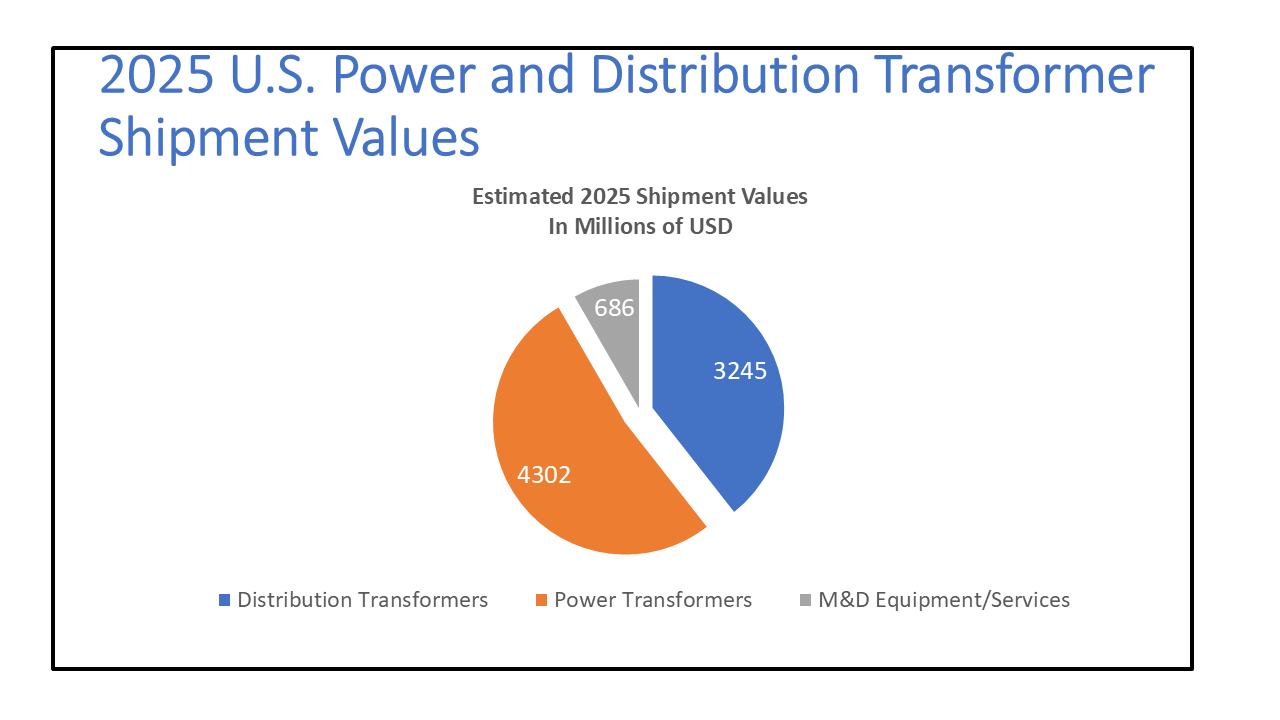
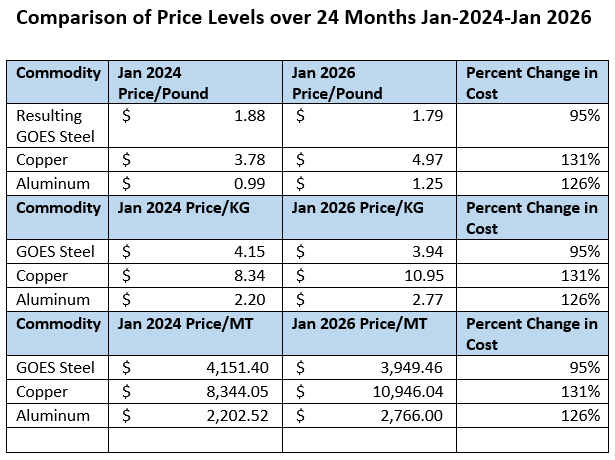
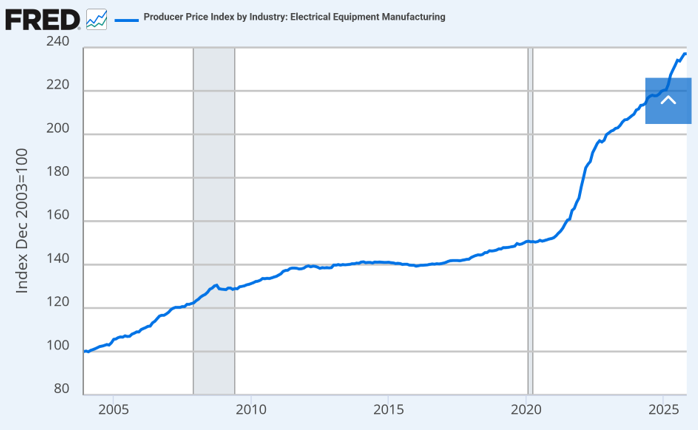
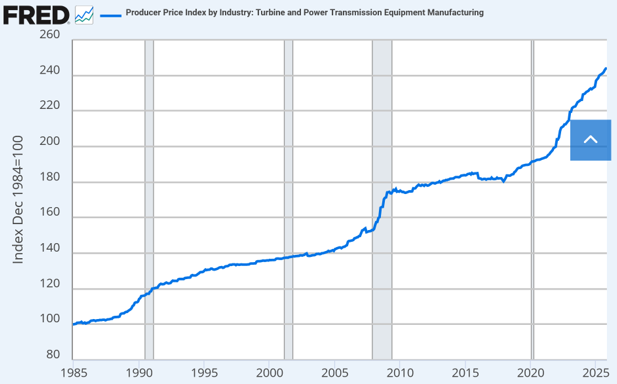


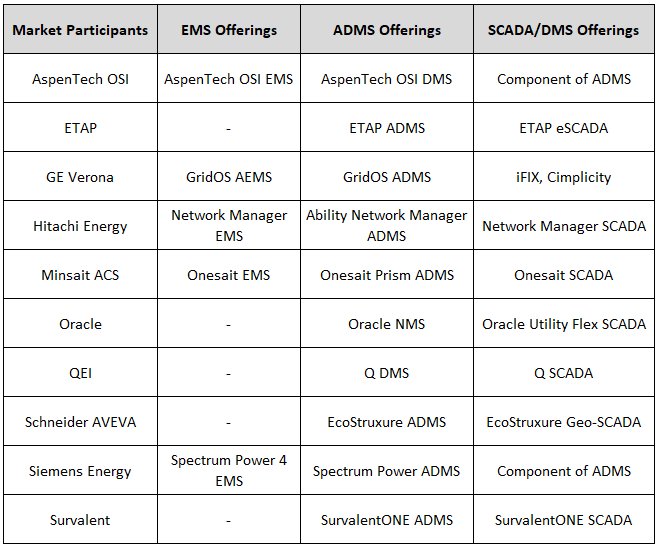
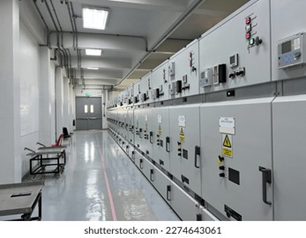

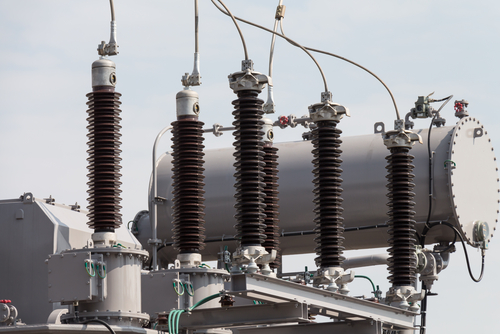
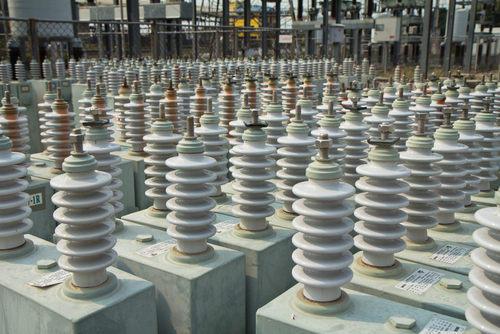
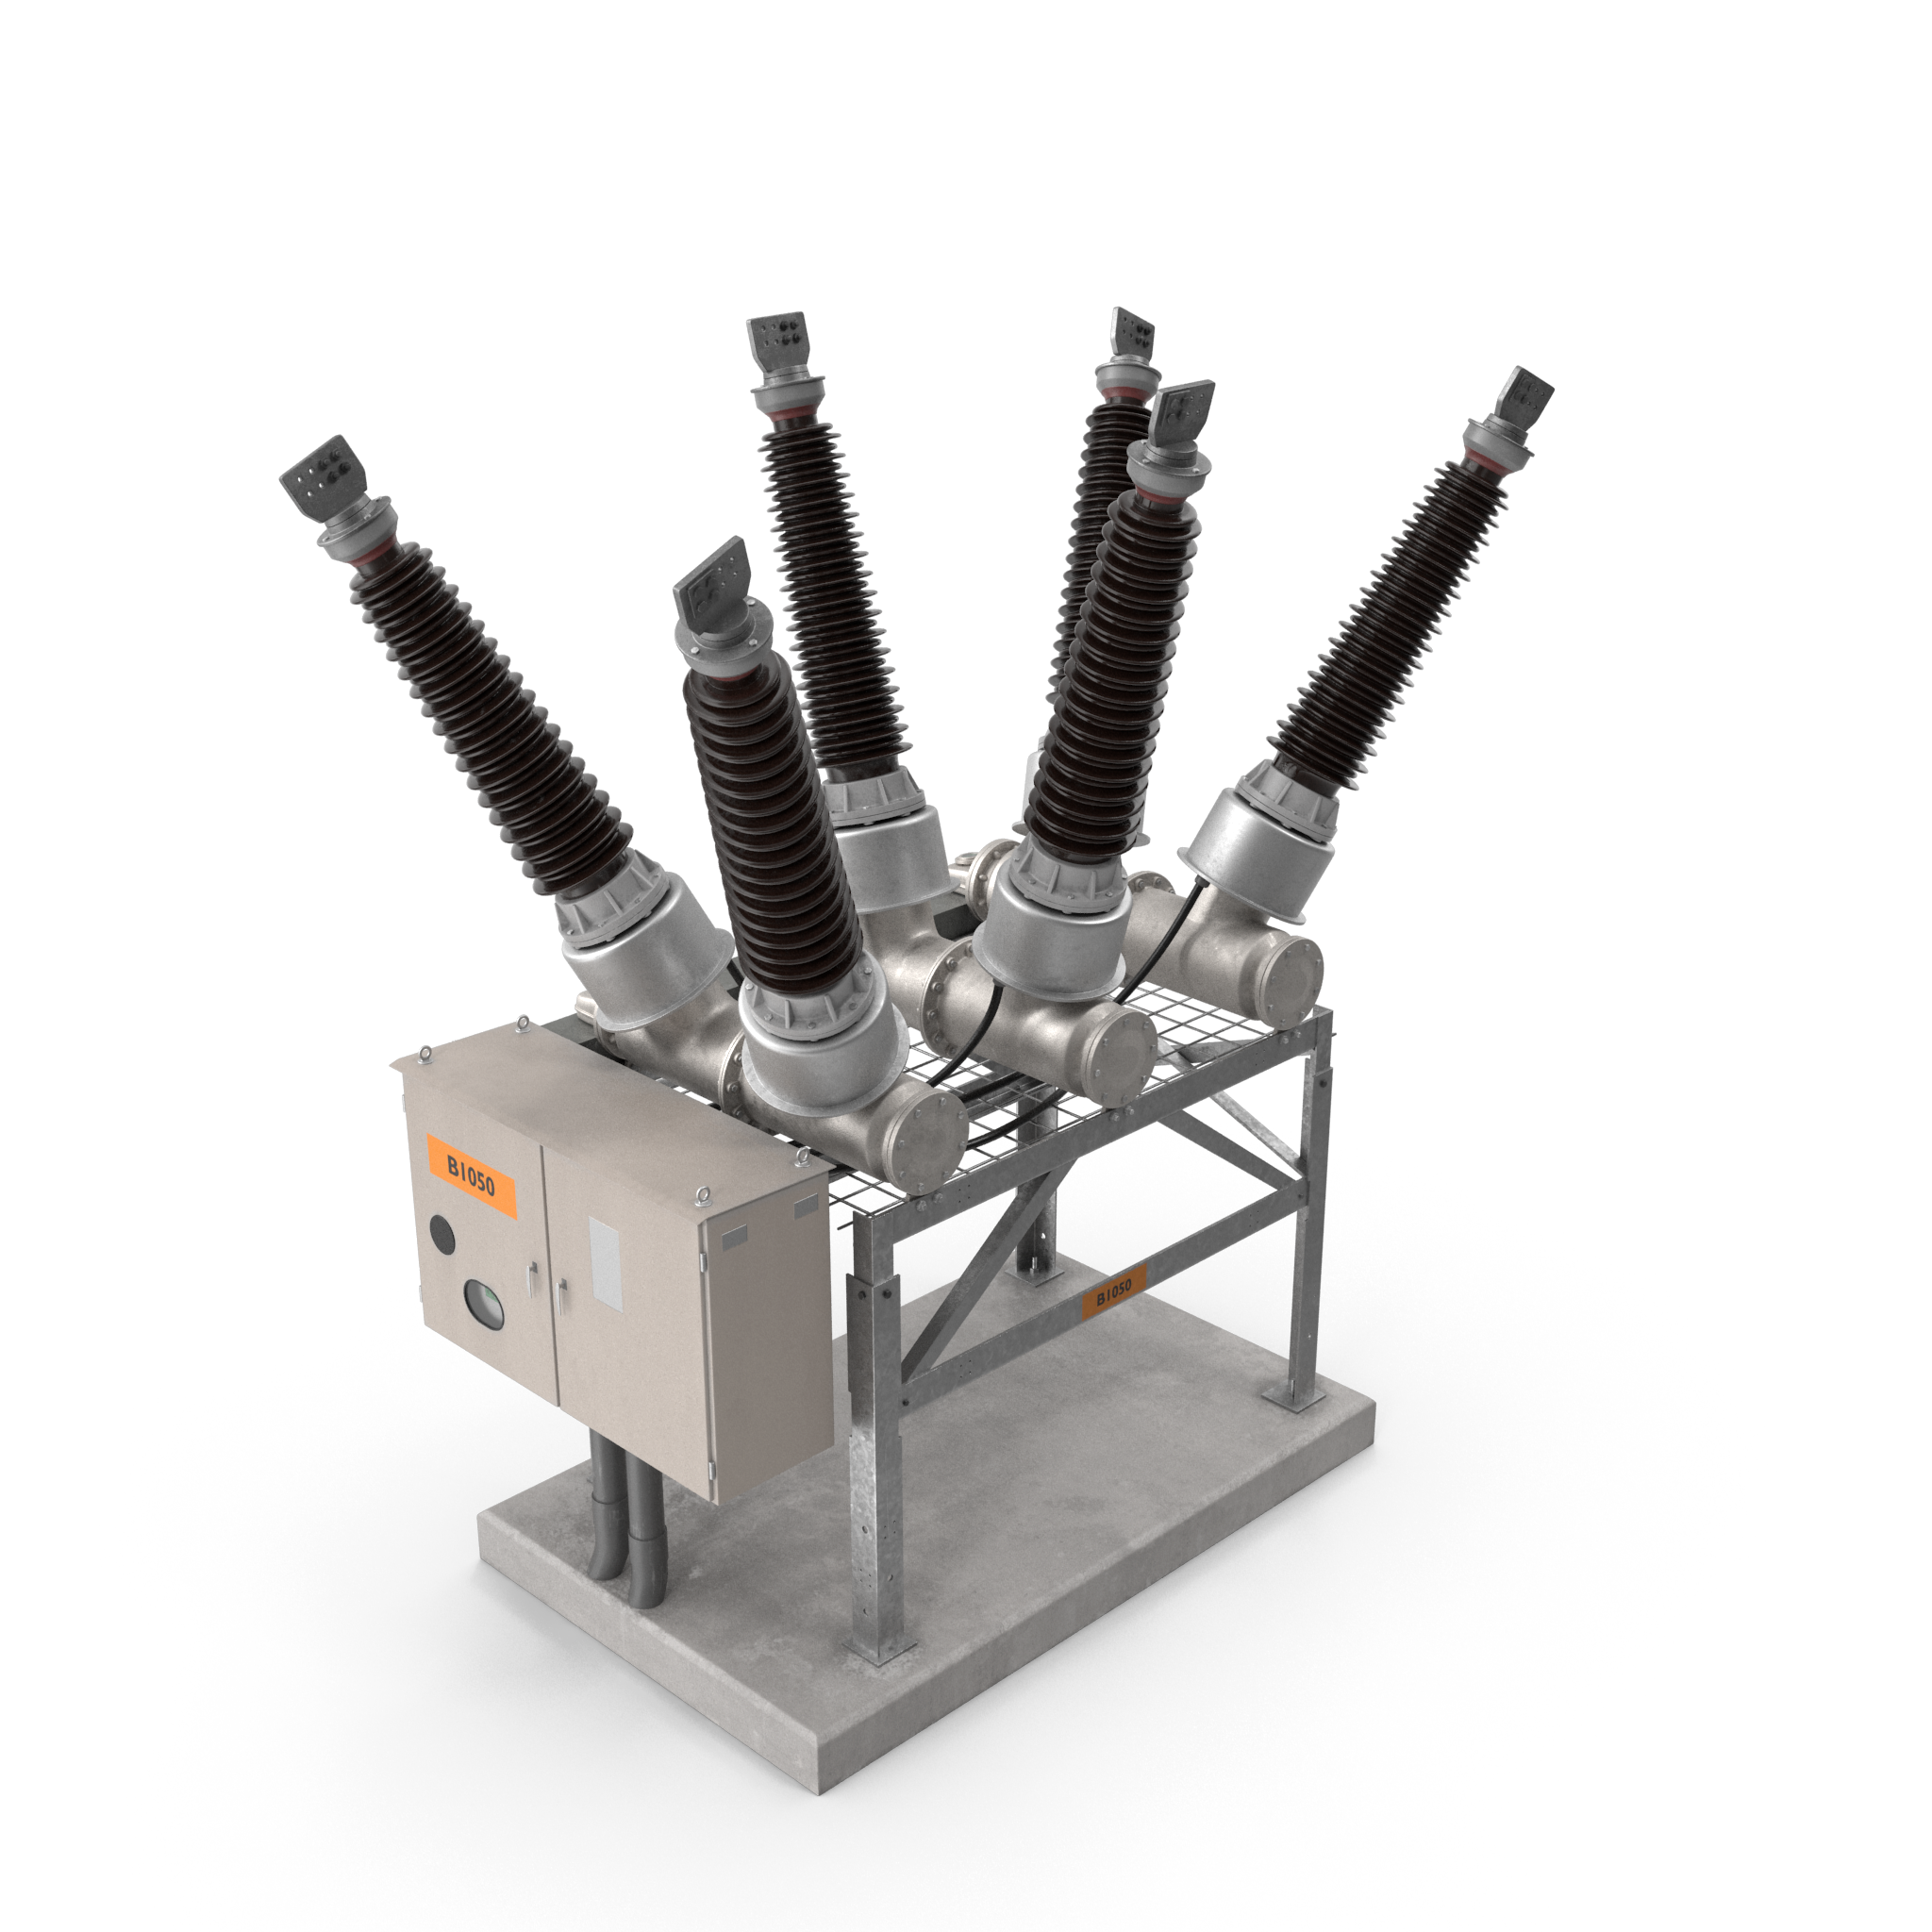
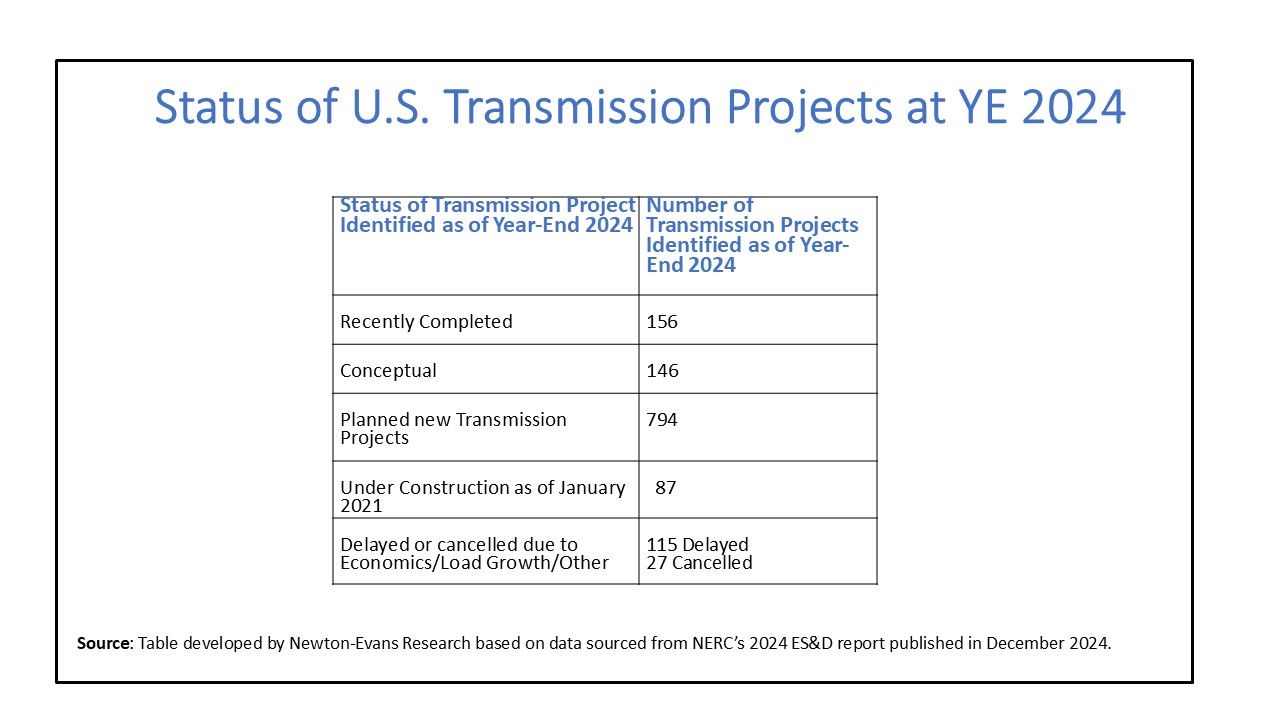
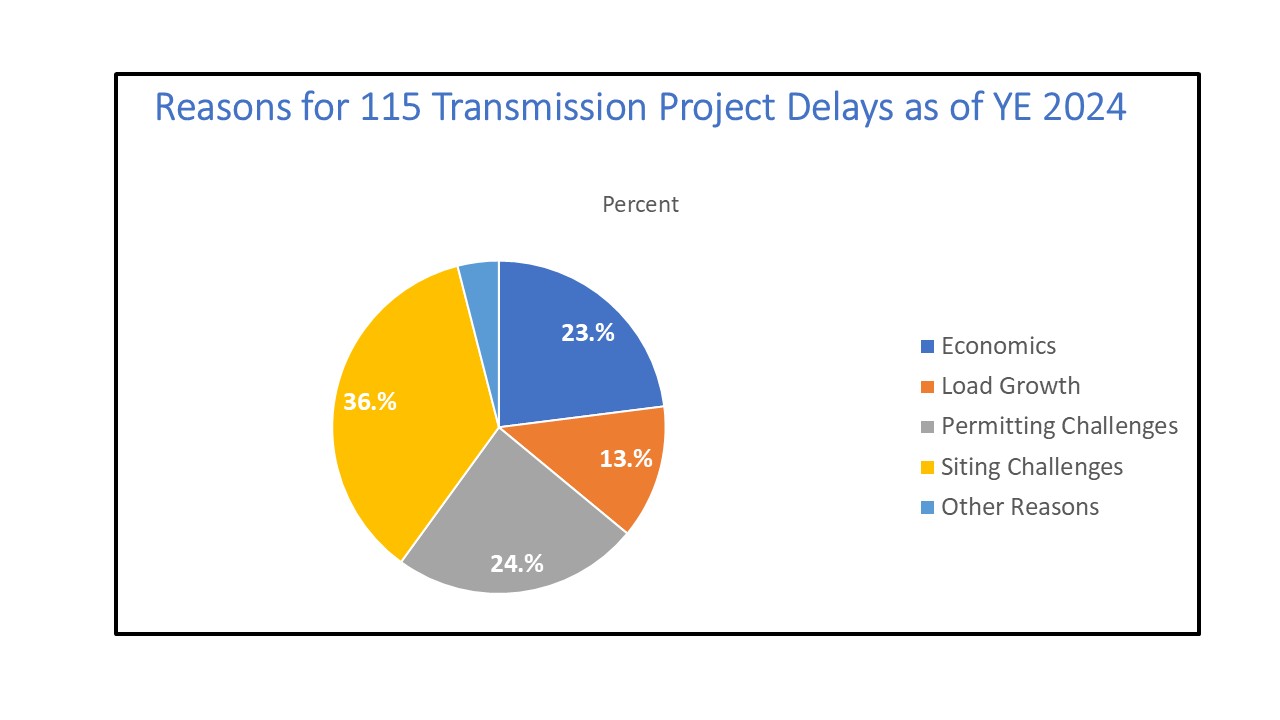
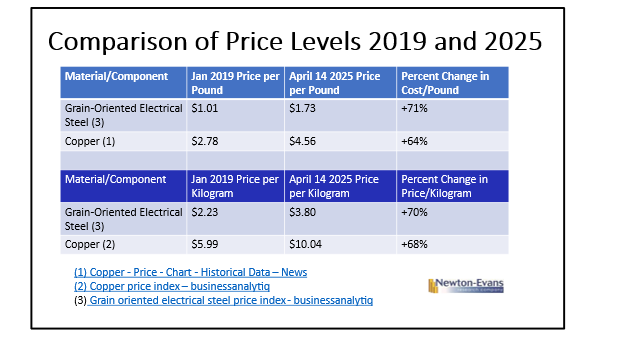
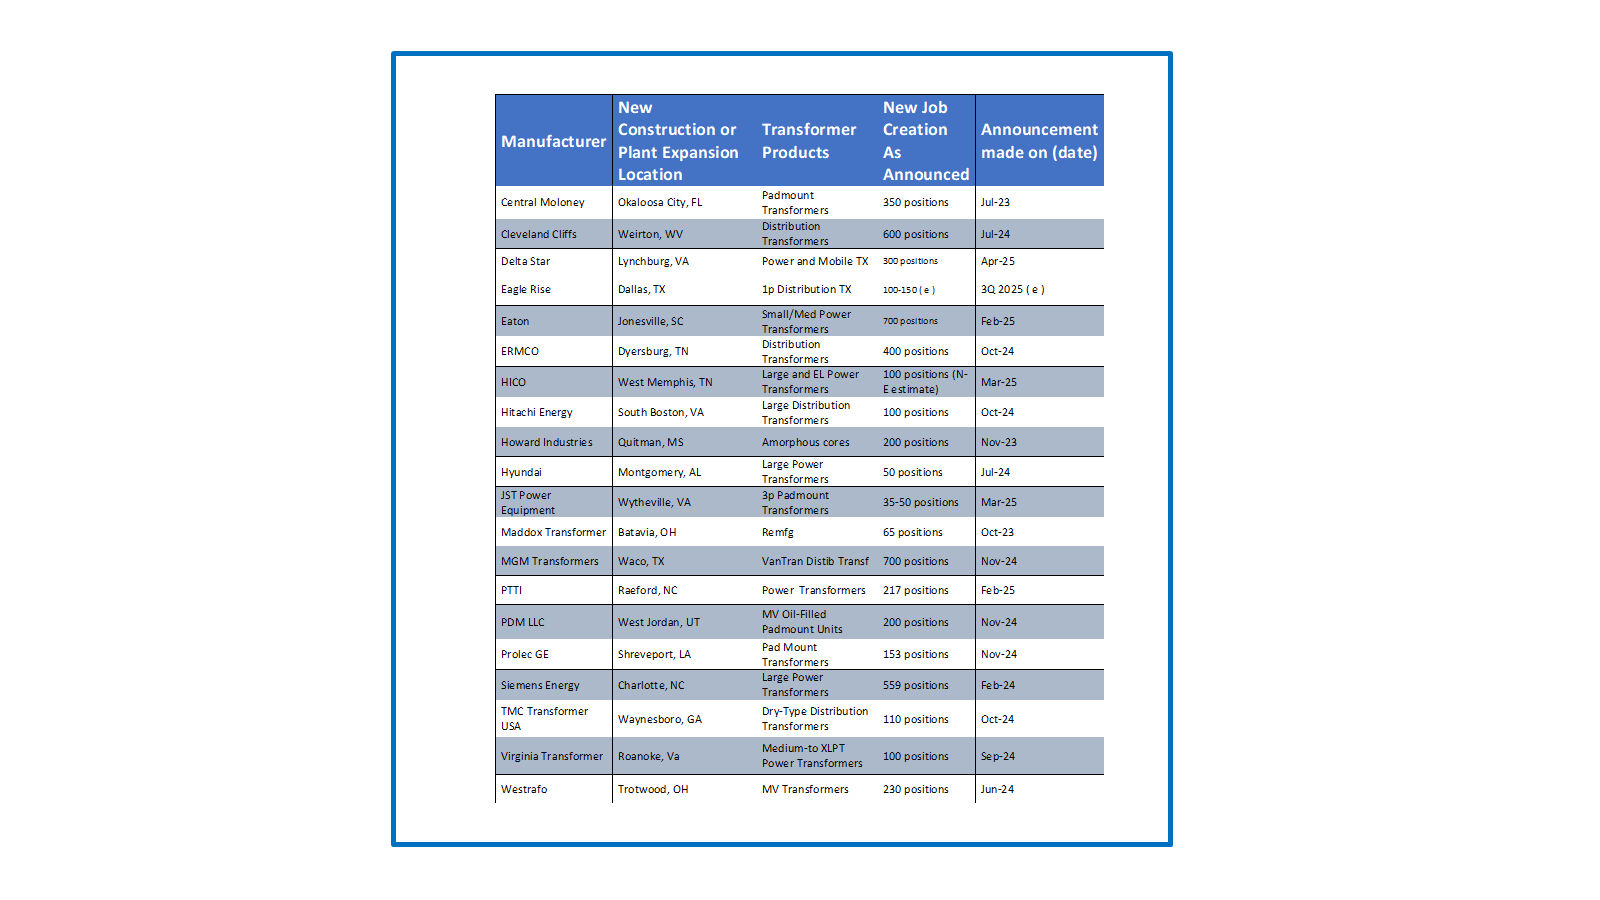
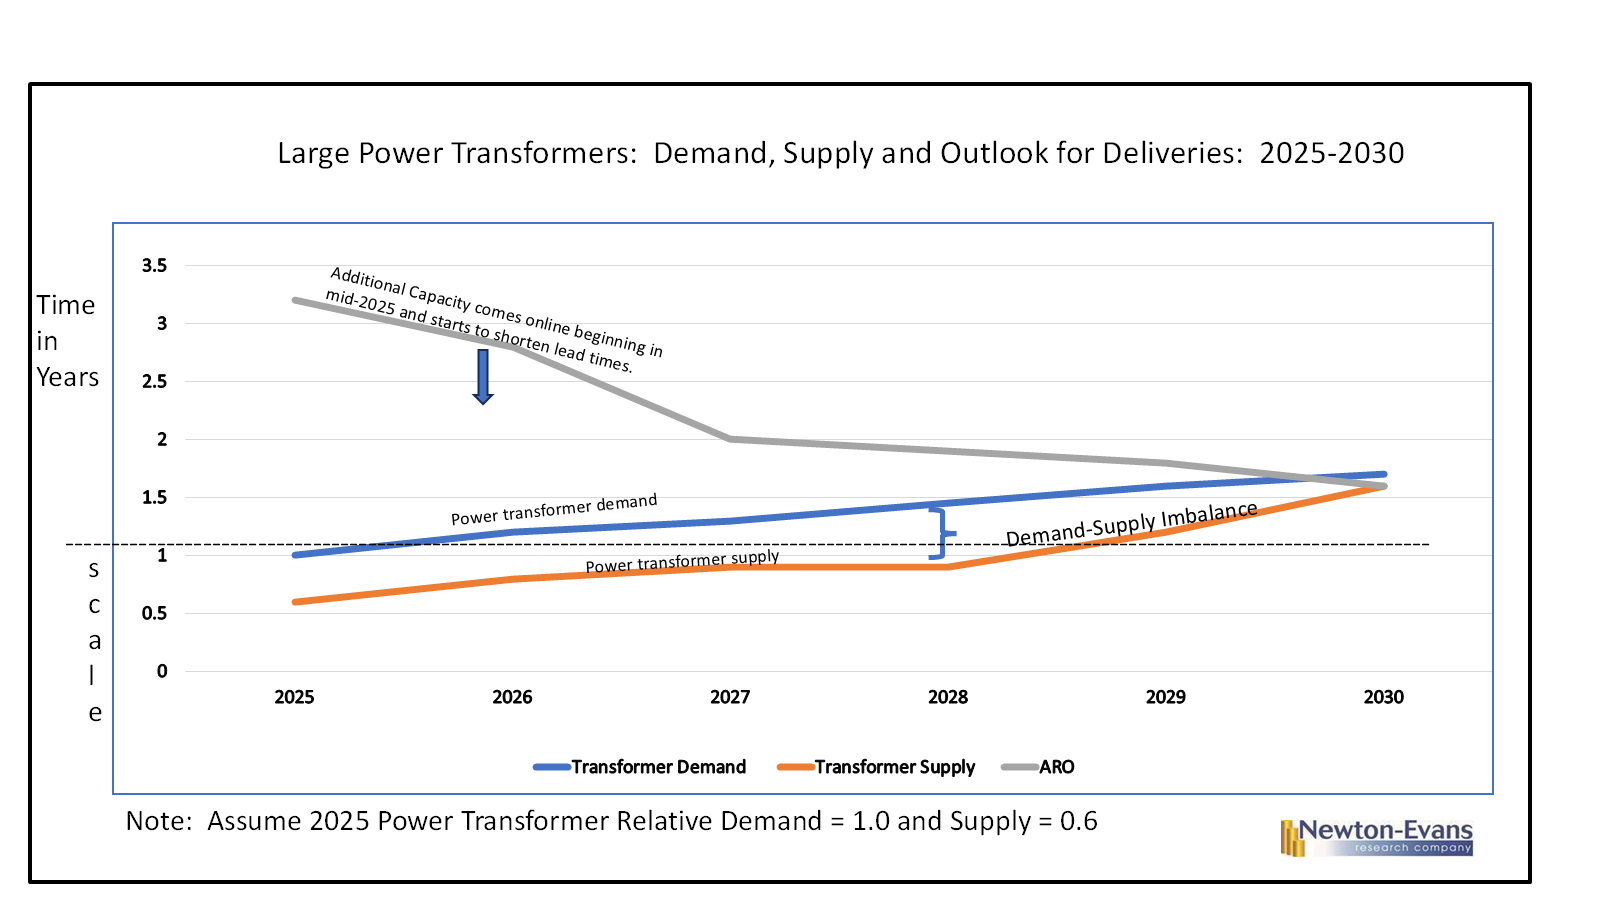


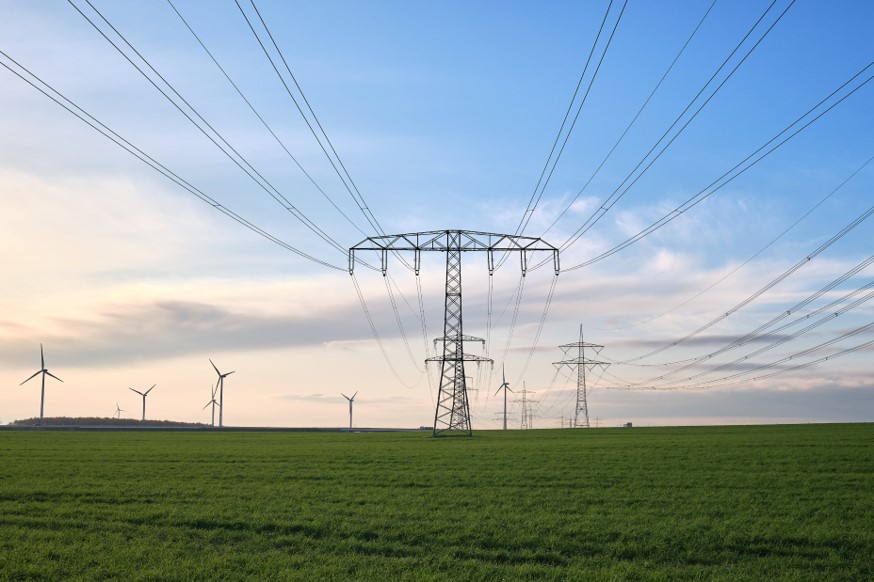
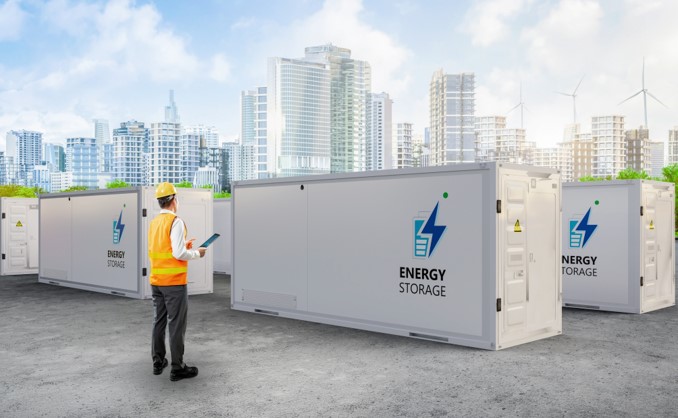
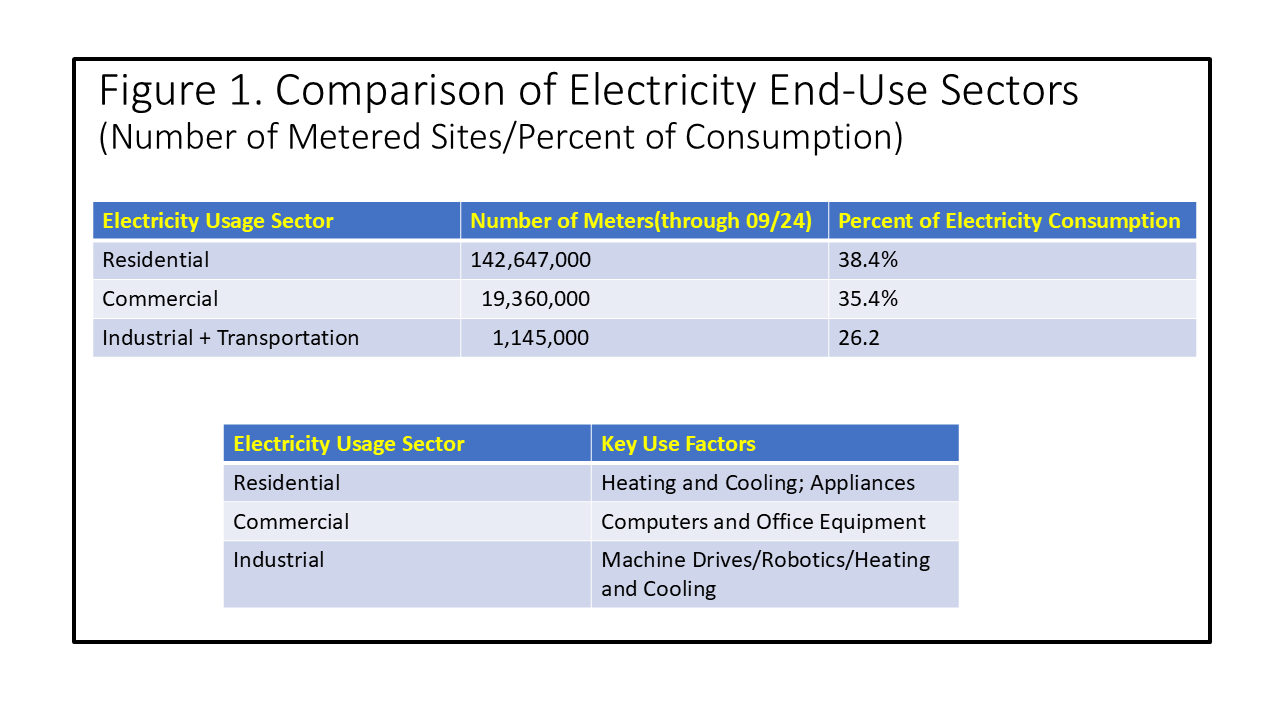
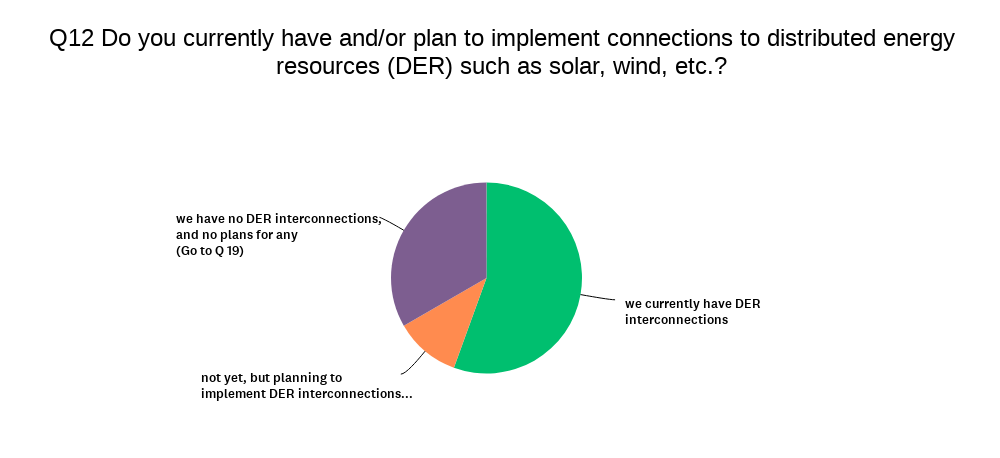
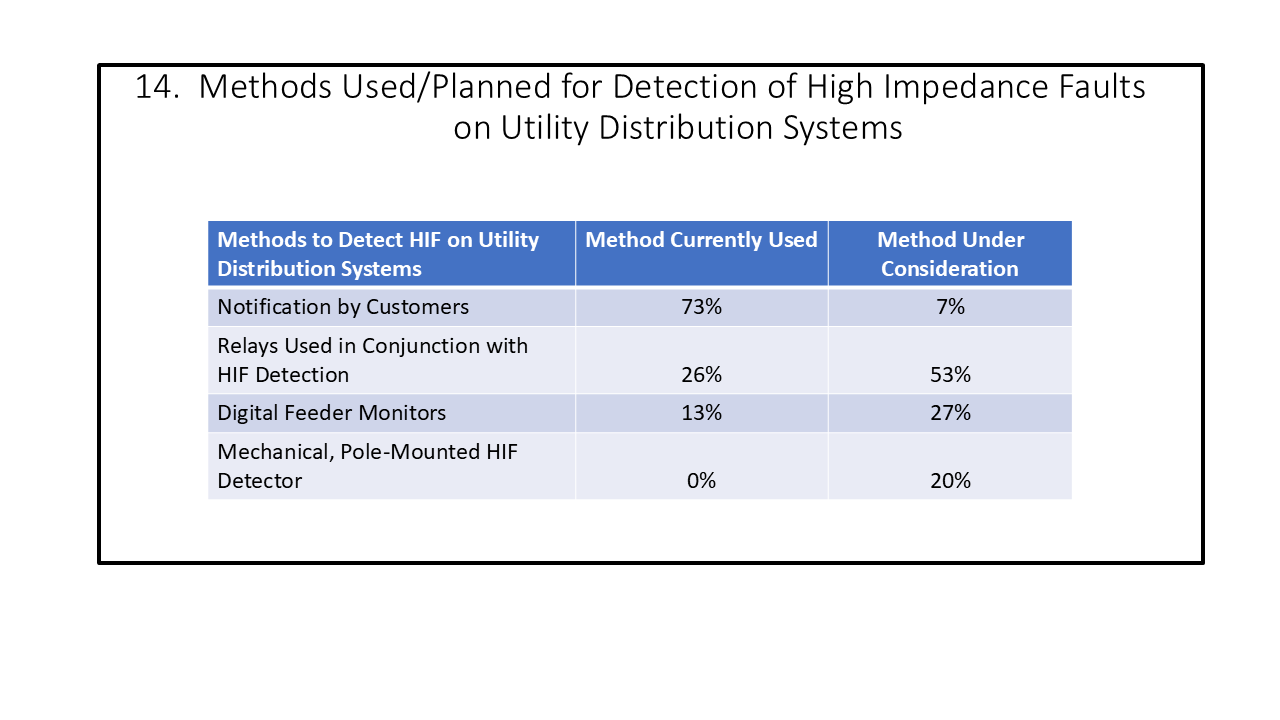
 summary reviews and highlights from completed studies