
Growth in real market demand is significantly lower than total year-over year market value increases would suggest. This is largely due to inflationary pressures, caused by rising prices for key commodities used in the production of electrical equipment. Key among these components are copper, electrical steel and aluminum. These commodities are under significant price pressures and production capacity limits, and are among the principal reasons for continually rising electrical equipment manufacturing costs.
Equipment prices (especially for power and distribution transformers, for switchgear and for capital HV transmission equipment) have doubled in the last five years, even as real demand has grown as well, but not as fast as inflationary pressures. These same inflationary pressures affected the production costs and increased prices for MV equipment as well as for HV equipment.
What seems to be different in today’s market composition versus that of a decade ago is that a higher percentage of electrical infrastructure equipment is now being purchased by end-user industrials and commercial enterprises than had earlier been the situation. Chief among these buyers are data center developers and large renewables project owners as well as the reshoring of American manufacturing plants. Also, the re-invigoration of the nation’s electric power grid is well underway, in an attempt to make electricity supply more secure, sustainable, more reliable, as well as becoming more resilient to the effects of climate change and climate challenges.
Much of the increase in demand for capital electrical equipment is coming from three sectors of large energy users.
- First is the continuing growth of renewables, despite the mistaken erosion of interest and significant cutbacks of research funding on the part of the current administration and its Department of Energy.
- Secondly is the huge increase in the number and size of data centers supporting AI developments.
- Thirdly is the reshoring of manufacturing industries, with numerous large industrial campus developments underway at this time.
- Each of these are responsible for placing capital electrical equipment orders earlier than required, sometimes 2-5 years in advance of the projected need for the equipment to be installed and operating at a plant site.
- Each of these factors impact and disrupt the historical cyclical equipment procurement activities of electric utilities of all types and sizes.
The electric power segment of the overall energy industry is indeed continuing to proceed with its transition from a fossil-fuel based power generation basis to a more sustainable and greener approach to providing reliable and resilient electric energy.
By staying the course toward reliability and resilience, electric power utilities will necessarily form alliances with non-utility providers of electric power. Concurrently, I believe we will see some new large campus-like industrial sites developed that will be self-powered, using resources ranging from gas turbines, to small modular nuclear reactors to on-site utility-scale renewable solar farms and wind parks. A newer and sustainable form of autoproduction and co-generation is being developed by and for use among manufacturers, data centers and utility-scale renewables sites.
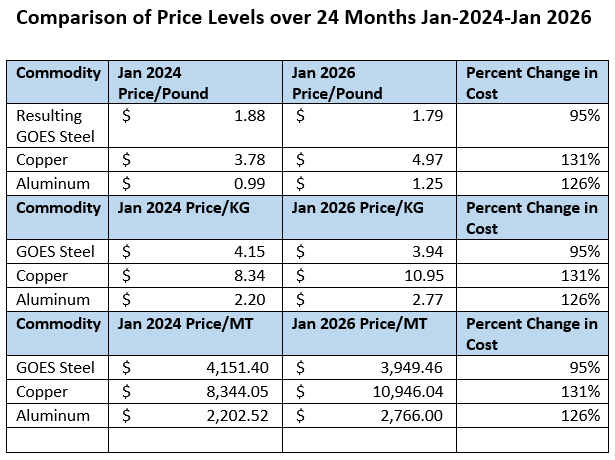
When we evaluate current year costs for key components of electrical equipment, we must look into the cost changes that have occurred over the past 24 months. The following table was developed at Newton-Evans using commercial market information sources. Note that the cost/unit of GOES steel had actually fallen from its high-water mark incurred in 2024 until this January, resulting in a five percent drop in price/unit over this time interval However, note the rather steep cost increases for units of copper (+31%) and aluminum (26%), whether measured in units of pounds, kilograms or metric tons (MTs).
One of the principal resources I have used and relied on over the years has been the economic information produced by the Federal Reserve Bank of St. Louis. The information on producer prices is published for dozens of commodities, and for many of these, the data is updated on a monthly basis. This vast array of economic research is known as FRED – for federal reserve economic data. Now in its 35th year, FRED is a major reliable source of business-related economic information vital to industry and commerce in the USA and internationally.
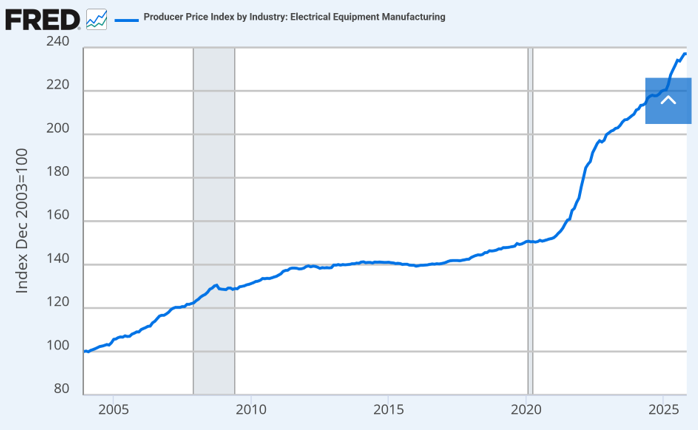
We are looking at FRED data in this article to help understand the huge increases in producer prices (manufacturing-related costs) that have affected the electrical equipment manufacturing industry. In this first chart, one can view the rather steep rise in producer prices that have occurred over 20 years. Note the sharp increases in the producer price curve beginning in the COVID era.
The second chart shows the steep rise in transformer producer prices that have been incurred over the past five years, nearly doubling on this index rising from 200 to more than 360 on the scale. Note that while it took 20 years for costs to double (from 100 in the base year of 2000) to a level of about 200 in 2020, it will likely take fewer than six years for transformer production costs to again double.
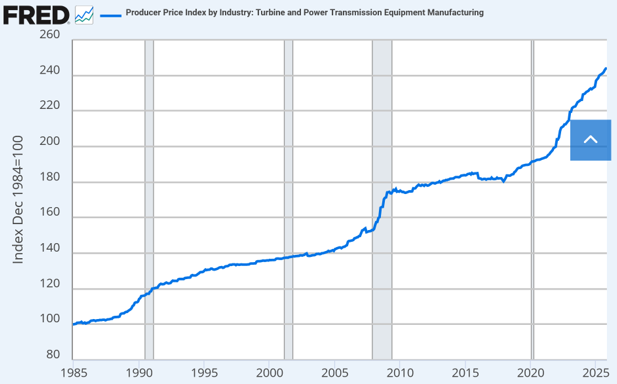
The final chart shows more of the same type of producer price rises, but includes power transmission equipment and turbines in this array.
Earlier this month (January 2026) The North American Electric Reliability Corporation (NERC) published its annual landmark study of transmission projects from across the United States. More than 1000 projects were documented and described in its annual report can view the status of U.S. transmission projects as of year-end 2025 reader.

There were about 62 project cancellations or delays due to a variety of reasons including economic considerations, load growth issues permitting issues and a few other considerations. The following chart illustrates the rationale provided for transmission project cancellations or significant delays.

The number of project cancellations and delays that occurred in 2025 was significantly lower (at 62 total) than the 142 such instances reported in the 2024 ES&D study. Our next topic will focus on the recent developments in the large power transformer segment of the industry.


 summary reviews and highlights from completed studies