
The 2024-2026 edition of Market Overview for Substation Automation includes 14 topical reports on modern substation components. This month’s article presents some highlights from 7 more of these market overview reports. In May, we provided another seven summaries of modern substation components. Read the article that follows below this article for that information.
More information on the entire 14-report series of substation automation components can be found here: https://www.newton-evans.com/product/overview-of-the-2024-2026-u-s-transmission-and-distribution-equipment-market-substation-automation-series/. The complete 2024-2026 series is priced at $1,450.00, with individual 3-5 page report summaries available for $195 per report. Each report provides component definitions, revenue estimates of key suppliers, market share assessments, outlook through 2026, and revenue split between sales to utilities and commercial-industrial buyers.
Sequence of Events Recorders: A sequence of events recorder (SER) is an intelligent standalone microprocessor-based system, which monitors external inputs and records the time and sequence of the changes occurring with any substation activities. Sequence of events recorders usually have an external time source such as a GPS or radio clock configured with Precision Time Protocol (PTP). When wired inputs change state, the time and state of each change is recorded.
SERs enable rapid root cause analysis after multiple events have occurred due to the secure recording of the sequence of events in the order of occurrence. SERs are therefore utilized as a diagnostic tool to minimize plant downtime. SERs are often interfaced with a SCADA system, distributed control system (DCS),or programmable logic controller (PLC). (Per Wikipedia).
Our shorter definition is: a sequence of events recorder is a microprocessor module within the electric power substation that logs time-stamped events. The SER functions can also be performed by other smart substation devices such as multi-function meters and recorders.
The total utility substation market for dedicated, stand-alone SOE/SER units is in decline due to the inclusion of SOE/SER functionality in other smart substation devices and systems. However, the decline among utility users is being offset by the application of SOE/SER devices among non-utility DER asset owners and operators, hence our outlook is for low-to-moderate growth over the mid-term years. See report SA08 for detailed information.
Power Quality Recorders: A power quality recorder (PQR) is a microprocessor module that most often is located within the substation that provides and enables regulatory power quality application, measurement, comparison, and profiling of power quality parameters at the individual electrical system interfaces: (e.g. generation, transmission, sub-transmission and distribution system levels). Source: Siemens Corporation. Substation-based PQ recorder sales have plateaued in recent years as single functions (like recording) tend to become one function of a multi-functional “system-like” instrument. Non-utility DER assets will likely procure power quality monitors to track power quality being produced by their generation assets prior to uploading to transmission lines. It is difficult to separate out specific units that ONLY perform power quality recording, so the authors are attempting to allocate costs back to the specific PQ function being studied. See report SA 09 for detailed information.
Reclosers: An Automatic Circuit Recloser (ACR) is a medium voltage circuit breaker equipped with a mechanism that can automatically close the breaker after it has been opened due to a fault. The market size estimates below include 1phase and 3phase hydraulic units, which category continues to represent as much as 17%-24% of the total recloser business in the U.S. Key factors influencing demand include:
- Aging and obsolescence of installed base of older reclosers
- Regulatory decisions on reliability improvements mandated
- DMS installations and growth in DA activities will likely spur additional ACR installations
- Utilities represent the bulk of the recloser market – 90%+ of total demand. Substations using recloser technology typically will have four units installed.
- Customer density and feeder length both affect system protection choices (reclosers versus fuses or sectionalizers).
- Ease of installation, maintenance-free operation, visual break and SCADA connectivity
See report SA10 for detailed information.
Substation Communications devices include Ethernet switches, hardened routers, teleprotection comms equipment, serial device servers and media converters. Key U.S. market participants in this multi-hundred million dollar market include CISCO, SEL, Siemens, Belden, GE Vernova, ABB and Hitachi Energy, along with many other suppliers of these devices. See SA12 for details on this market.
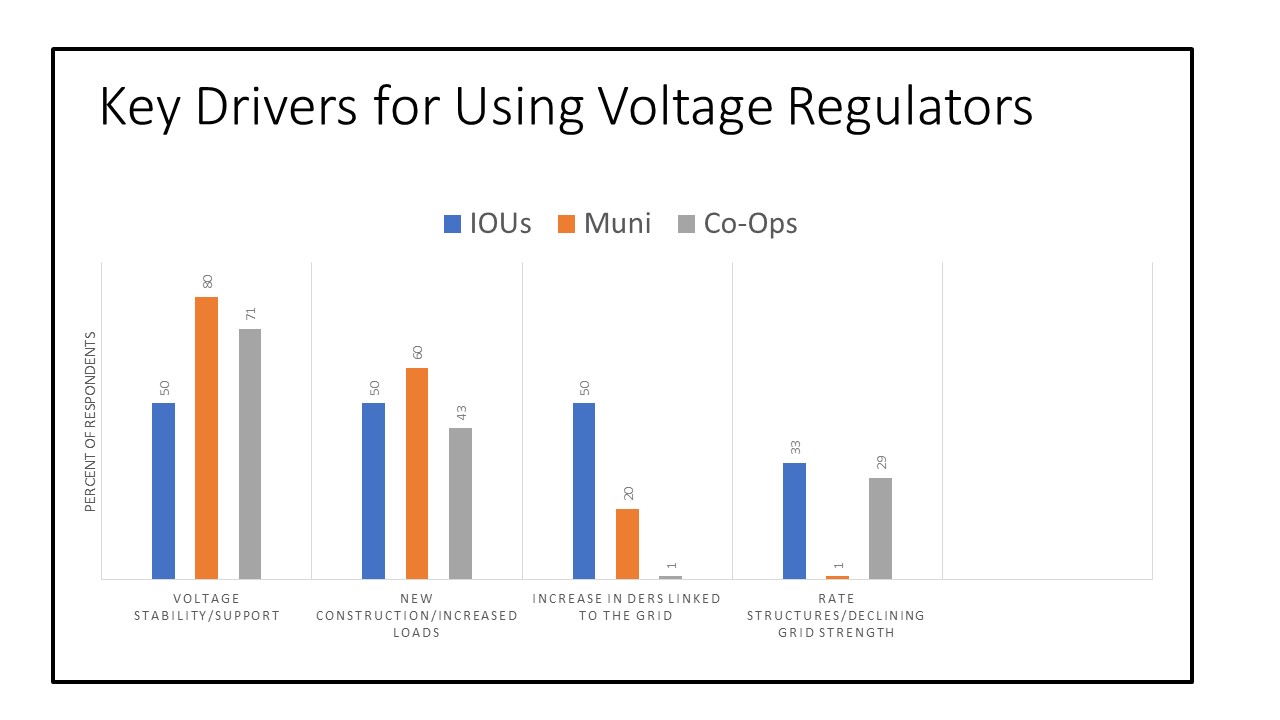
Voltage Regulators: A voltage regulator (VR) is an electrical device designed to automatically maintain (regulate) a constant voltage level. VRs may use an electromechanical mechanism, or passive or active electronic components. Depending on the design, it may be used to regulate one or more AC or DC voltages. This overview provides information only on substation-based single and three phase VR units. The larger portion (60-70%) of the total VR market is for single phase units placed along MV feeder paths. In both applications, VRs are often paired with power capacitors
Electric utilities also use mechanical automated units (AVRs) to adjust voltage levels as loads fluctuate on each feeder in an MV distribution network. MV AVRs are basically transformers with multiple taps used to change the turns ratio and thereby alter output voltage. A voltage regulator may be a simple “feed-forward” design or may include negative feedback control loops. It may use an electromechanical mechanism, or electronic components. Depending on the design, it may be used to regulate one or more AC or DC voltages.
In an electric power distribution system, voltage regulators may be installed at a substation (1p/3p) or along distribution lines (1p) so that all customers receive steady voltage independent of how much power is drawn from the line. The DA portion of the VR market is primarily for automated control of single-phase units installed along MV distribution lines. See report SA13 for detailed information on the substation voltage regulator market.
Substation Timing Synchronization Devices/Clocks: Special clocks used for precise timing indications for improving grid reliability, gaining a better understanding of the power system operation, predicting and preventing systems-wide faults, and testing and verifying operation of protective devices. (Source: http://www.arbiter.com/news/technology.php?id=4)
Similar to the findings obtained from equipment manufacturers in a major Newton-Evans study of timing synchronization, IRIG-B was the most frequently mentioned timing reference used by
U.S. utilities as recently as 2014, as cited by 87% of a survey sample comprised of 30 US electric power utilities. NTP (37%) and direct GPS signals (30%) were mentioned as the next most important references. IRIG-B continues to be widely used in mid-2024.
In that same referenced Newton-Evans study, 21% indicated that their utility would be specifying Precision Timing Protocol (PTP) Standard IEEE 1588 within five years for use as the substation timing references. One utility had already begun standardizing on the PTP standard. Importantly, as American utilities migrate to IEC 61850, time synchronization becomes ever more critical to reliable operations. Much of the increase in demand for timing synchronization devices is a result of the proliferation of synchrophasor measurement units across North America. The North American Synchrophasor Initiative (NASPI) provides a great deal of information on their website here https://www.naspi.org/ .
More than 80% of US utilities have recently indicated that they rely on a stand-alone clock for embedded GPS. The utility industry’s migration to Ethernet and IP-based telecommunications to/from substations will likely include a changeover from “legacy” approaches (typified by IRIG- B) to IEEE-1588 to enable more precise network monitoring and sequence of events recording. See report SA14 for details.
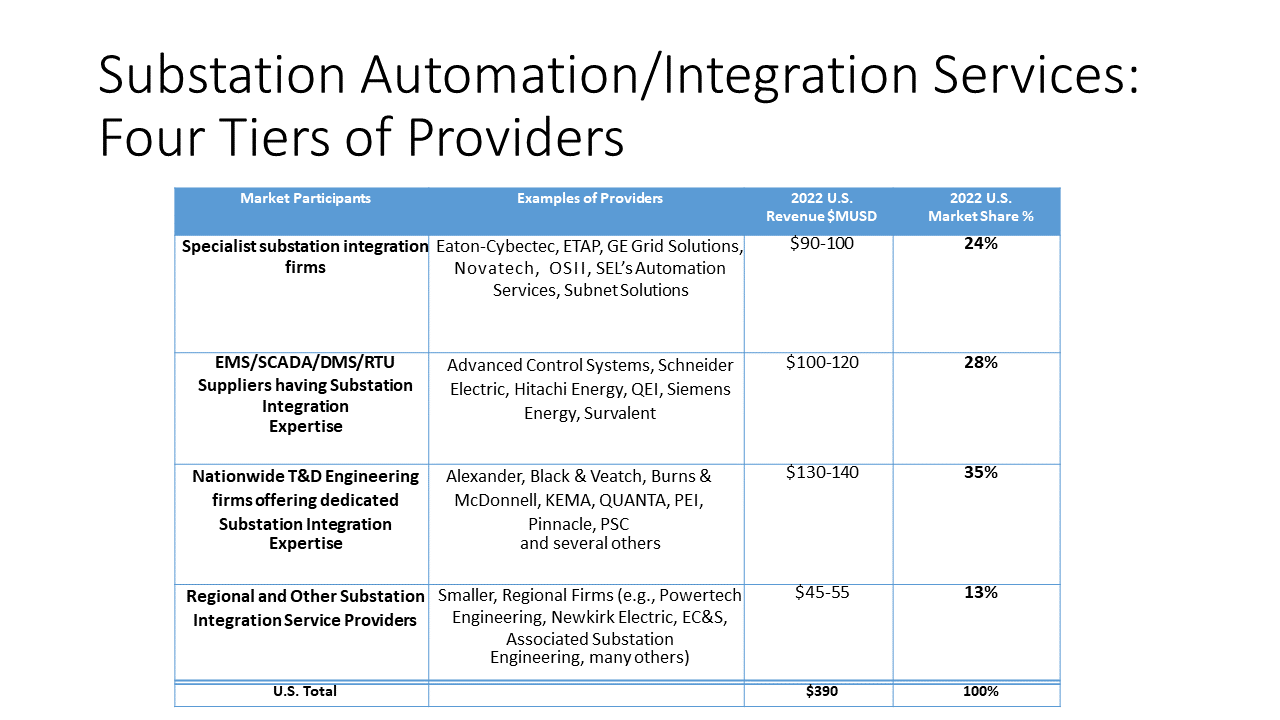
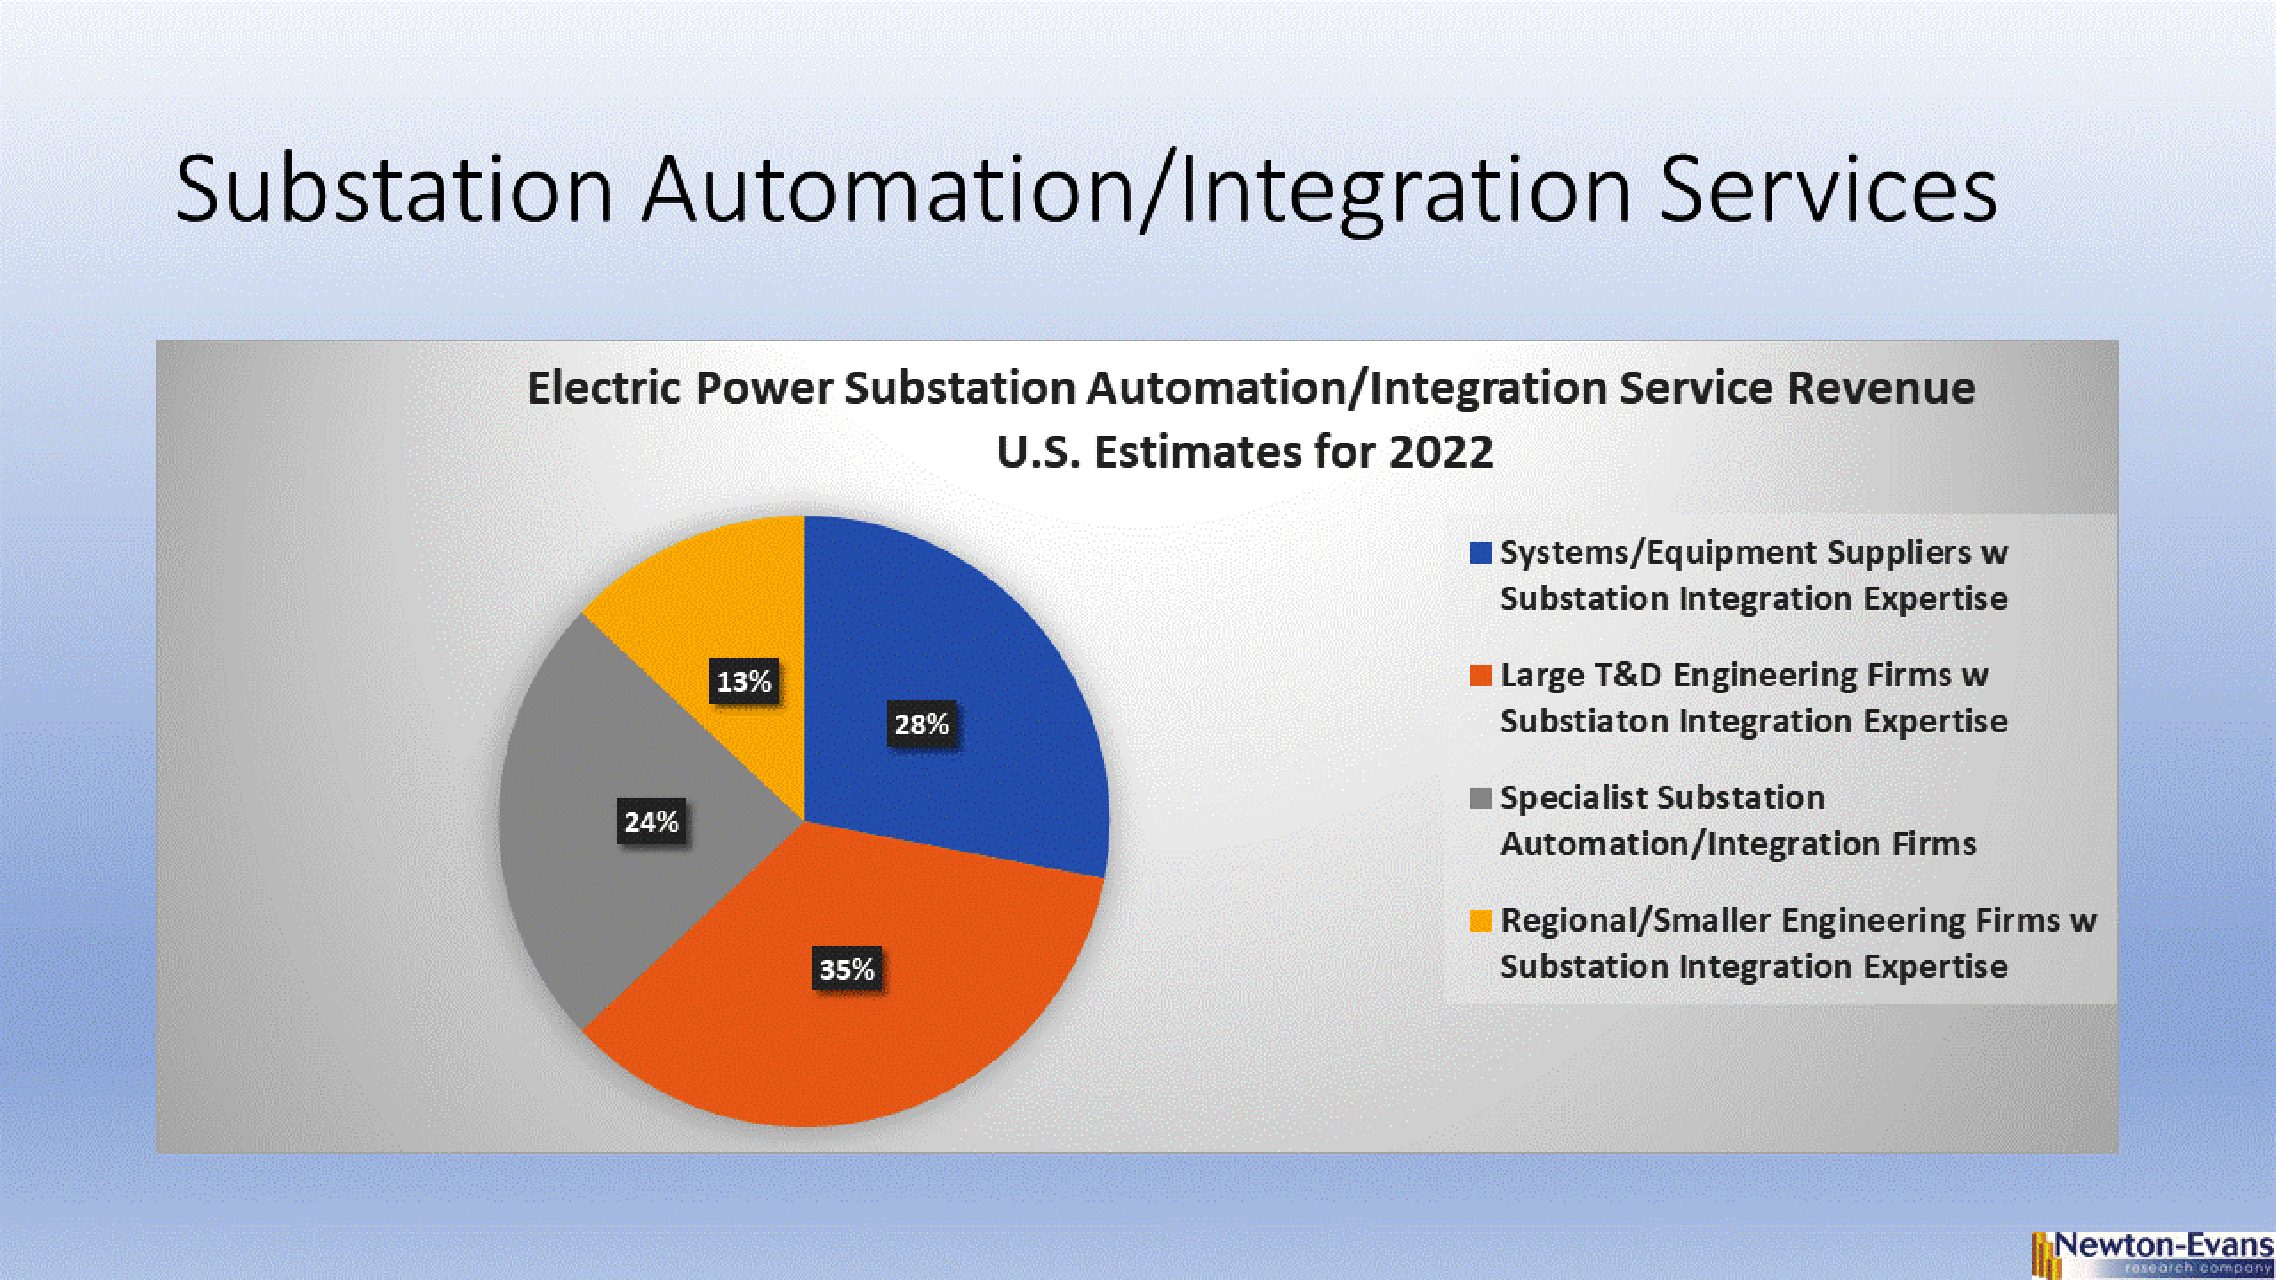
Substation Automation Integration Specialists are firms (or corporate business units) that can assist with or provide a full or partially automated substation on a turnkey basis. Such firms include dedicated businesses such as listed in the SA platforms report SA03 (NovaTech, SEL Automation Services, Subnet Solutions, Eaton-Cybectec), or can be business units of larger companies engaged in the electric power automation business as EMS/SCADA suppliers, RTU manufacturers or protection and control specialists.
Three “tiers” of substation integration providers are included in our assessment:
- Specialist substation automation integration services
- SCADA /P&C industry participants with substation devices (RTUs, FEPs, Relays, IEDs, platforms) offering substation integration expertise
- T&D Engineering Services firms with substation integration expertise
See report SA11 for information that describes the substation automation integration specialist companies in each tier along with revenue estimates for each tier.
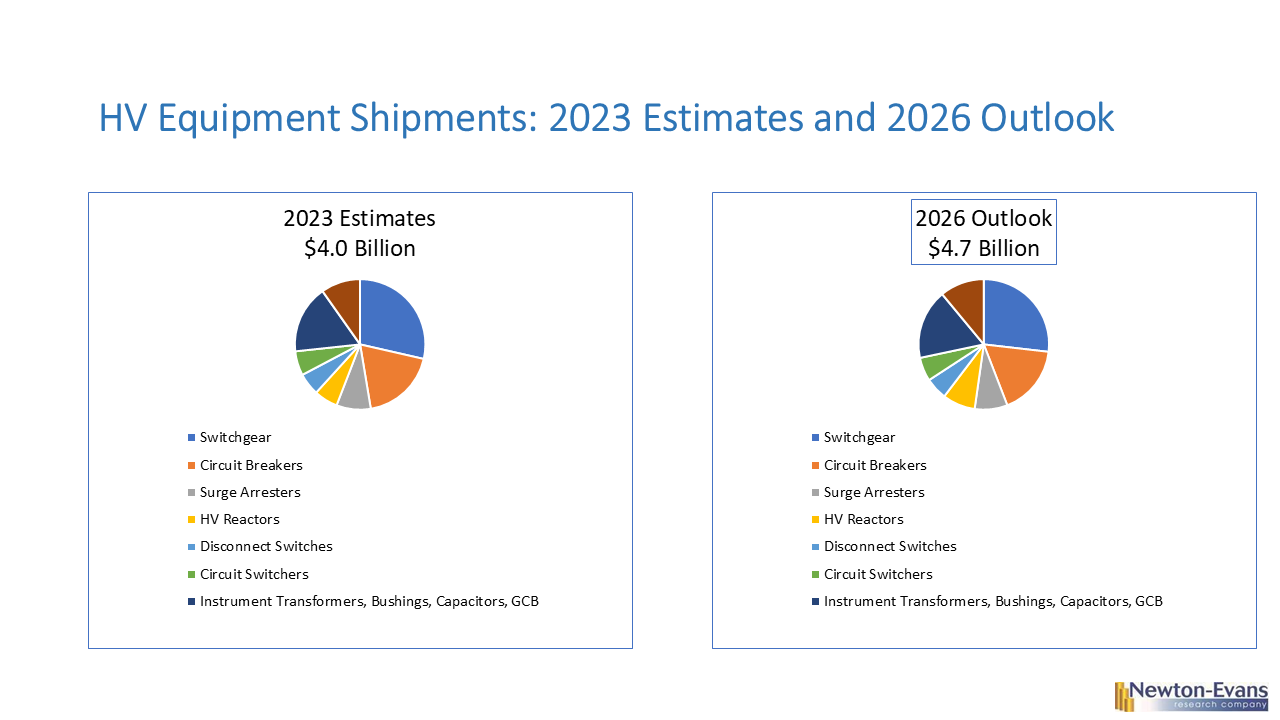
We hope you enjoy reading this summary of market information on substation components. In July, we will provide readers with part one of a two-part series describing high voltage substation equipment as used in the United States.


 summary reviews and highlights from completed studies