
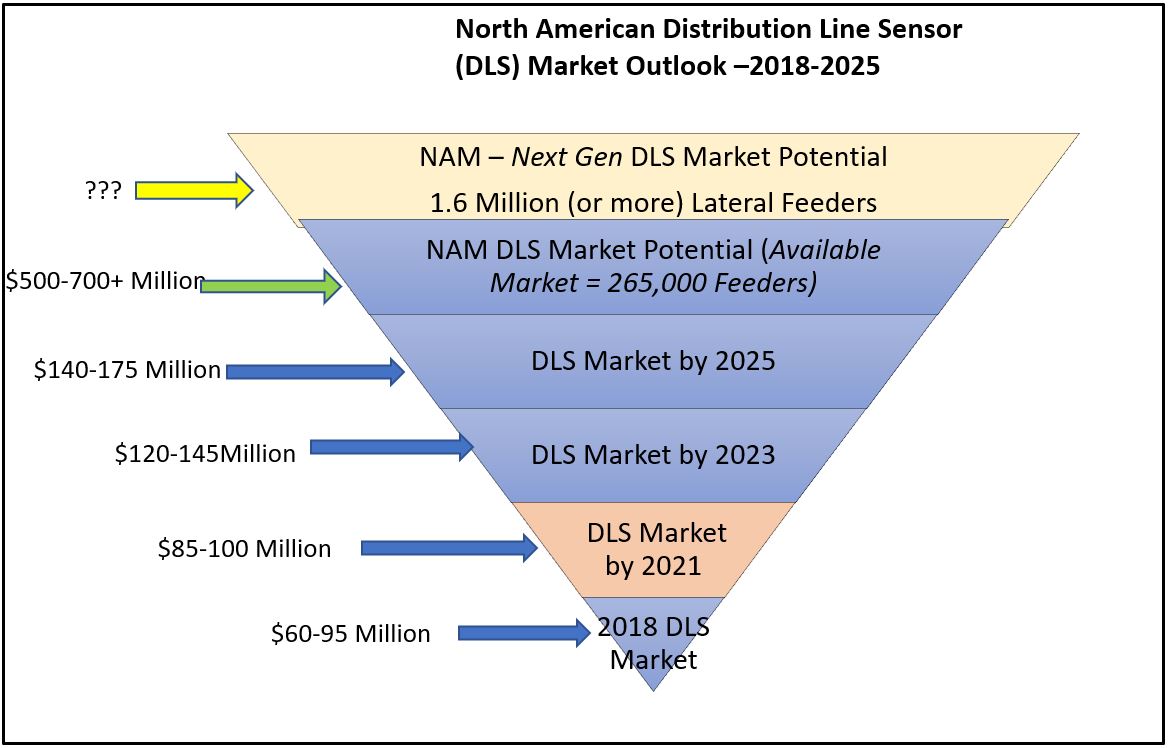
Newton-Evans Research has developed the following info-graphic illustrating what the company believes to be a T&D market segment wherein growth is currently outpacing some other “smart grid” related developments. This is the distribution line sensing equipment/device (or DLS) market. For this article I have combined two related sub-segments of the DLS market – distribution fault indicators and line-mounted monitoring devices. With more than a quarter million primary distribution feeders in operation in the U.S. there is a growing requirement to monitor feeder performance, as is now being done on several thousands of the most critical distribution feeders in operation throughout the U.S. and Canada. Implementations of DLS systems are being undertaken to shore up grid reliability, provide resilience and help minimize outage frequency and outage duration.
Two excellent baseline studies completed by the DOE’s PNNL a few years ago have helped with understanding related power distribution grid trends in the U.S. (1) These reports, along with periodic DOE grid modernization reports to Congress, have provided the impetus for Newton-Evans to continue researching grid modernization, taking into account some of the ground-breaking activities being undertaken by many of the nearly 3000 U.S. and Canadian distribution utilities. Newton-Evans will soon be conducting the third in a series of short-length, repetitive surveys conducted over multiple years.
-
- Distribution Fault Indicators are devices which indicate the passage of fault current. When properly applied, they can reduce operating costs and reduce service interruptions by identifying the section of feeder that has failed. At the same time, fault indicators can increase safety and reduce equipment damage by reducing the need for sometimes hazardous fault-chasing procedures. The bulk of installed basic fault indicators are stand-alone devices that provide visual alerts at fault locations along the feeder.
-
- Line Mounted and line post mounted MV/DA monitoring devices perform online monitoring of voltage and/or current and/or loads, but do not provide controlling functions. Power sources may include power lines themselves using CT/PT technology, batteries, or even small solar panels. Modern line monitoring devices are typically part of a tri-partite system comprised of the line-mounted sensors, a communications modem and PC-based (or SCADA-based) analytical software. This allows for local or remote monitoring of the device. Some devices are designed with lighted indicators for onsite/local line problem status notification, as are the DFIs so designed.
-
- On average, the typical respondent utility in our first DLS study (a commissioned research program) had about a third of a million customers. Overall, the participants in that study accounted for about a 12% sample of the quarter million (3) MV feeders then in operation across North America. A second study was conducted informally during 2020-2021 with a smaller sample of utilities.
-
- Almost all of the survey participant utilities in both Newton-Evans’ studies were using some form of basic line sensor/fault current indicator technology on at least some of their operating feeders. Several utilities were using smart sensors by 2019 and a few were using the then-newest generation of advanced multi-attribute line sensors by 2021.
-
- The top attributes being measured or monitored among a large group of listed attributes included fault detection, current monitoring, fault magnitude, voltage measurement and time stamping of events. In the more recent (2020-2021) informal follow-on to the 2019 study, these attributes remained as key benefits of smart and intelligent line sensor program adoption.
-
- On the topic of data/status communications for smart or advanced line sensors, a significant percentage of respondents (about one-third across two surveys) reported that their line sensor installed base was using built-in communications with about one quarter of installed devices reporting to line-mounted communications modules – using a mesh networking approach.
-
- Distribution line sensors by 2021 were most often reporting to SCADA systems (as indicated by about one half of respondents) while about one in five officials cited communications links to the utility’s outage management system (OMS).
-
- Line sensor placement by 2021 was being determined by:
-
-
- evaluating feeder performance and starting with the instrumentation of weaker performing feeders and “critical” customer feeders.
- Analyzing customer density and load characteristics on the feeder. Typically, the higher the customer density coupled with the criticality of the feeder, coupled with larger load-carrying feeders were prime candidates for line monitoring installations.
- Locating sensors strategically- near switching points, along with feeders routing power to hospitals, police, fire, military installations, government facilities.
-
-
- Line sensor placement by 2021 was being determined by:
-
- Importantly, line sense device/system decision-making criteria to both earlier groups of surveyed utilities centered around four attributes: “reliability and long service life”, “ease of installation”, “battery-free operation” and “price.” It will be interesting to see how these compare this summer with a 24-month interval between studies.
- In addition to distribution line sensors and line-mounted monitoring devices, there are ancillary market segments that utilize the same, or similar, sensing and communications technology as found in transmission lines, underground lines and T&D capital assets, including substations and field equipment.
Newton-Evans will be re-surveying participants from the earlier distribution line monitoring studies, as well as including additional utilities in a planned mid-2023 update to these earlier research efforts. Interested parties can contact Newton-Evans for further information regarding participation as sponsors or as survey participants.
__________________
Sources:
- U.S. Department of Energy, Pacific Northwest National Laboratory, Electric Distribution Systems – Volume 3 (July 2016) and Modern Distribution Grid – Three Volume Study (2017)
- “Smaller” utilities involved in the Newton-Evans studies included those having at least 30,000 customers. Note that there are also more than 1,500 North American electric power distribution utilities with each having fewer than 30,000 customers.
- As estimated by Newton-Evans, based partly on the PNNL studies cited in footnote 1 above and as accounted for in Newton-Evans own files of counts of primary feeders.
 summary reviews and highlights from completed studies