Posted on

Voltage Regulators –Guardians for Maintaining High Quality Power Distribution


Voltage Regulators –Guardians for High Quality Power Distribution  –   In an electric power distribution system, voltage regulators may be installed at a substation (1p/3p) or along distribution lines/feeders (1p) so that all customers receive steady voltage independent of how much power is drawn from the line. The distribution automation portion of the VR market is primarily for automated control of single-phase units installed along MV distribution lines.  In both distribution feeder and substation applications, VRs are often paired with power capacitors.

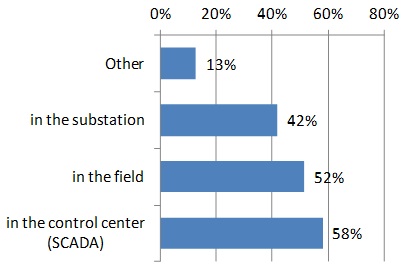
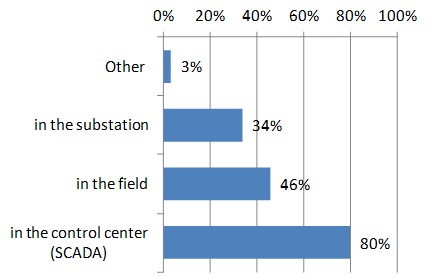
Currently the single most important factor behind the growth in use of single-phase VRs is the increase in installations of distributed energy resources (DERs) and the impact that these grid-connected resources are having on grid voltage stability.  Because of the variable or intermittent nature of DERs, there is a need to control voltage fluctuations, hence the push to utilize more VRs by utilities that are actively involved with DERs in their service territories. New construction of C&I sites, residential developments in the suburbs as well as feeder length in large rural areas are also key factors affecting the increase in use of VRs.  Certain regulatory actions in place or planned will continue to influence the need for VRs.  See the chart just below for a look at key drivers for using VRs among IOUs, Public Utilities and electric power cooperatives.

Click on chart to enlarge! 
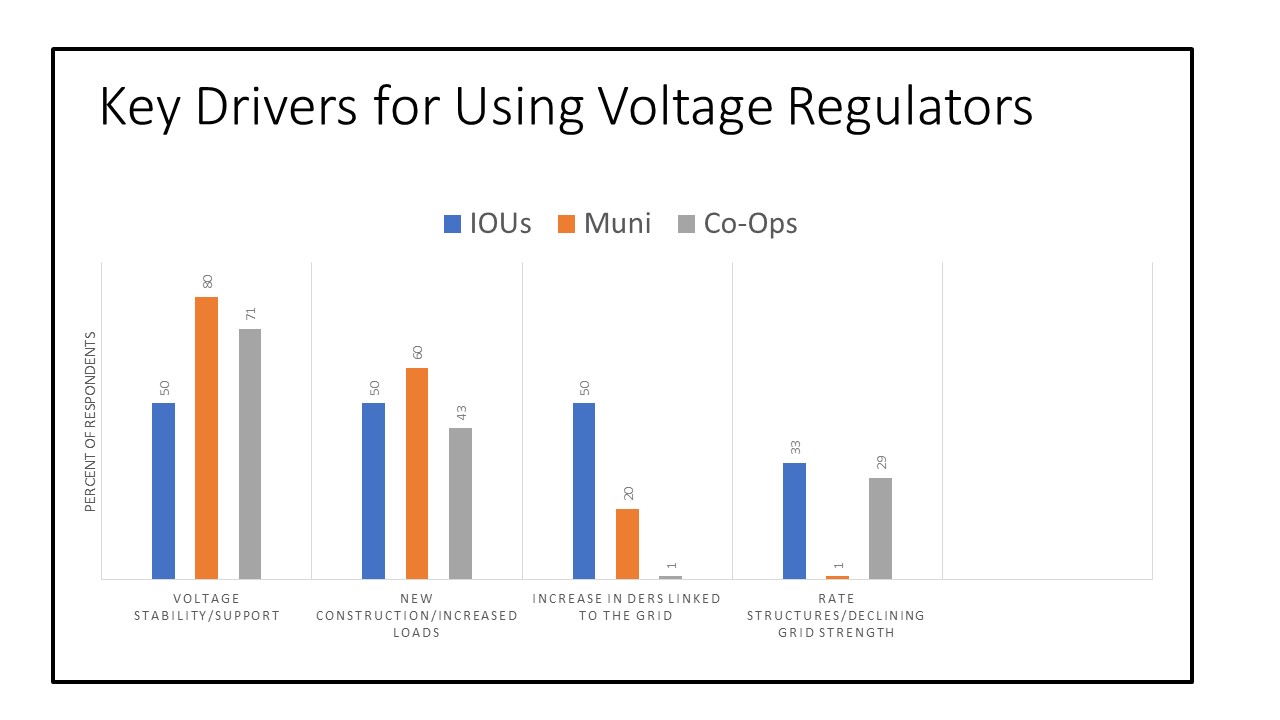
Keep in mind that the nation’s electric power delivery/distribution system was designed for one-way (or uni-directional) power flow, and with the development of DERs, we are confronted with a need to accommodate two-way (bi-directional) power flows.  This changes the feeder voltage profile making voltage regulation more challenging, with DERs tending to cause local voltage rise along a distribution feeder.  The expansion of variable renewable generation resources owned by industrial/commercial companies will mean growth in the non-utility/C&I portion of the VR market.  VRs will continue to be used to control voltage levels from these intermittent resources.

 Market Size Summary:

Some suppliers have suggested to Newton-Evans that growth of 10-15% per year is on the horizon.  A lot will depend upon continuing economic recovery and the promulgation of DER-friendly policies and regulations being planned over the coming years.  Currently, there are three principal manufacturers of automated voltage regulators serving the domestic U.S. market.  These are General Electric, Eaton Corporation and Siemens.  Together the “Big Three” control about 75-80% of the combined VR market.  Howard Industries is next, followed by Schneider Electric, Delta Star and Basler Electric with each having a few dozen important utility customers and together comprise the remaining 20-25% of the VR equipment manufacturing market.

Market Drivers:

Currently the single most important market driver for using VRs is the increasingly important role of distributed energy resources (DERs) and the impact that these resources are having on grid voltage stability.  Because of the variable nature of DERs, there is a need to control voltage fluctuations, hence the push to utilize more VRs by utilities that are actively involved with DER in their service territories. New construction of C&I sites and residential developments in the suburbs are also key factors affecting the growth in use of VRs.  Feeder length among suburban, exurban and rural areas and some regulatory actions also impact the need for VRs.  Perhaps offsetting some of the demand from DER sites will be a new generation of smart inverters that may be able to provide voltage stability from DER sites to the grid interconnection point, perhaps nullifying the need for a separate VR on-site.  The publication of IEEE 1547-2018 provides for performance criteria for DERs including such functionality as Volt-Var control which can also be used to help regulate the distribution system.

Operational Driver:

While the use of single-phase VRs can be found among many hundreds of IOUs, public utilities and cooperatives, the use of three phase VRs is less widely used among munis and co-ops.  Many of these utilities have switched to using single-phase units where, in the past, they may have used a three-phase unit.  There are also about 10-15% of utilities that do not use VRs, but rely on on-load tap changers (OLTCs) with substation transformers – most within urban corridors with relatively short distribution feeders.  You may want to return here for more articles on grid modernization over the coming weeks and months.

Posted on

Distribution Line Sensing: Approaches to Monitoring Distribution Feeders for Power Quality and Improving Reliability Indices

Newton-Evans Research has developed the following info-graphic illustrating what the company believes to be a T&D market segment wherein growth is currently outpacing some other “smart grid” related developments.  This is the distribution line sensing equipment/device (or DLS) market.  For this article I have combined two related sub-segments of the DLS market – distribution fault indicators and line-mounted monitoring devices. With more than a quarter million primary distribution feeders in operation in the U.S. there is a growing requirement to monitor feeder performance, as is now being done on several thousands of the most critical distribution feeders in operation throughout the U.S. and Canada.  Implementations of DLS systems are being undertaken to shore up grid reliability, provide resilience and help minimize outage frequency and outage duration.

Two excellent baseline studies completed by the DOE’s PNNL a few years ago have helped with understanding related power distribution grid trends in the U.S. (1)   These reports, along with periodic DOE grid modernization reports to Congress, have provided the impetus for Newton-Evans to continue researching grid modernization, taking into account some of the ground-breaking activities being undertaken by many of the nearly 3000 U.S. and Canadian distribution utilities. Newton-Evans will soon be conducting the third in a series of short-length, repetitive surveys conducted over multiple years.

    • Distribution Fault Indicators  are devices which indicate the passage of fault current. When properly applied, they can reduce operating costs and reduce service interruptions by identifying the section of  feeder that has failed. At the same time, fault indicators can increase safety and reduce equipment damage by reducing the need for sometimes hazardous fault-chasing procedures.  The bulk of installed basic fault indicators are stand-alone devices that provide visual alerts at fault locations along the feeder.
    • Line Mounted and line post mounted MV/DA monitoring devices perform online monitoring of voltage and/or current and/or loads, but do not provide controlling functions. Power sources may include power lines themselves using CT/PT technology, batteries, or even small solar panels. Modern line monitoring devices are typically part of a tri-partite system comprised of the line-mounted sensors, a communications modem and PC-based (or SCADA-based) analytical software. This allows for local or remote monitoring of the device. Some devices are designed with lighted indicators for onsite/local line problem status notification, as are the DFIs so designed.
    • On average, the typical respondent utility in our first DLS study (a commissioned research program) had about a third of a million customers. Overall, the participants in that study accounted for about a 12% sample of the quarter million (3) MV feeders then in operation across North America. A second study was conducted informally during 2020-2021 with a smaller sample of utilities.
    • Almost all of the survey participant utilities in both Newton-Evans’ studies were using some form of basic line sensor/fault current indicator technology on at least some of their operating feeders. Several utilities were using smart sensors by 2019 and a few were using the then-newest generation of advanced multi-attribute line sensors by 2021.
    • The top attributes being measured or monitored among a large group of listed attributes included fault detection, current monitoring, fault magnitude, voltage measurement and time stamping of events. In the more recent (2020-2021) informal follow-on to the 2019 study, these attributes remained as key benefits of smart and intelligent line sensor program adoption.
    • On the topic of data/status communications for smart or advanced line sensors, a significant percentage of respondents (about one-third across two surveys) reported that their line sensor installed base was using built-in communications with about one quarter of installed devices reporting to line-mounted communications modules – using a mesh networking approach.
    • Distribution line sensors by 2021 were most often reporting to SCADA systems (as indicated by about one half of respondents) while about one in five officials cited communications links to the utility’s outage management system (OMS).
    • Line sensor placement by 2021 was being determined by:
          1. evaluating feeder performance and starting with the instrumentation of weaker performing feeders and “critical” customer feeders.
          2. Analyzing customer density and load characteristics on the feeder. Typically, the higher the customer density coupled with the criticality of the feeder, coupled with larger load-carrying feeders were prime candidates for line monitoring installations.
          3. Locating sensors strategically- near switching points, along with feeders routing power to hospitals, police, fire, military installations, government facilities.
    • Importantly, line sense device/system decision-making criteria to both earlier groups of surveyed utilities centered around four attributes: “reliability and long service life”, “ease of installation”, “battery-free operation” and “price.”  It will be interesting to see how these compare this summer with a 24-month interval between studies.
    • In addition to distribution line sensors and line-mounted monitoring devices, there are ancillary market segments that utilize the same, or similar, sensing and communications technology as found in transmission lines, underground lines and T&D capital assets, including substations and field equipment.

Newton-Evans will be re-surveying participants from the earlier distribution line monitoring studies, as well as including additional utilities in a planned mid-2023 update to these earlier research efforts.  Interested parties can contact Newton-Evans for further information regarding participation as sponsors or as survey participants.

__________________

Sources: 

  1. U.S. Department of Energy, Pacific Northwest National Laboratory, Electric Distribution Systems – Volume 3 (July 2016) and Modern Distribution Grid – Three Volume Study (2017)
  2. “Smaller” utilities involved in the Newton-Evans studies included those having at least 30,000 customers. Note that there are also more than 1,500 North American electric power distribution utilities with each having fewer than 30,000 customers.
  3. As estimated by Newton-Evans, based partly on the PNNL studies cited in footnote 1 above and as accounted for in Newton-Evans own files of counts of primary feeders.
Posted on

Newton-Evans Research Releases 2021-2023 Edition of Nine Market Snapshot Reports on Distribution Automation Topics Covering the Electric Power Industry in the United States.

Newton-Evans Research Releases 2021-2023 Edition of Nine Market Snapshot Reports on Distribution Automation Topics Covering the Electric Power Industry in the United States.

U.S. Sales of Distribution Automation Components estimated at more than $1.9 Billion in 2020, Forecast to Increase to $2.3 Billion by 2023.

August 30, 2021.  Ellicott City, Maryland.  The Newton-Evans Research Company has announced its latest publication of a set of 9 U.S. distribution automation market two-to-four-page summaries.  The new series of market overview reports (executive market summaries) includes supplier listings, representative products, and estimated market segment size, vendor market share estimates and market outlook through 2023.   Electric utilities accounted for about 92% of all purchases of distribution automation related goods and services.

A majority of distribution automation equipment purchased by American utilities and industrial firms is produced or assembled in the United States.   U.S. sales of DA components including equipment smart controllers, DA applications software licensing, dedicated communications infrastructure and DA-related engineering services, is expected to exceed $2 Billion in 2021.  Another several hundred million dollars will be spent again this year for “DA-related infrastructure equipment” including reclosers, MV voltage regulators and MV capacitors.

The Distribution Automation series ($975.00) includes U.S. 2020 market size, market share estimates and 2021-2023 market outlook for these product and service categories:

  • DA01 – Automatic Circuit Recloser Controls
  • DA02 – DA/DMS System Components (including distribution network analysis; distribution network condition monitoring and fault location and characterization)
  • DA03 – Voltage Regulator Controls
  • DA04 – Capacitor Bank Controllers
  • DA05 – Fault Indicators (covering both fault current indicators and faulted circuit indicators)
  • DA06 – Pole Top RTUs
  • DA07 – Line Mounted Monitoring Devices
  • DA08 – Communications Components for DA (covering PLC/DLC; cellular and 900Mhz)
  • DA09 – Engineering Services for Distribution Automation Projects (covering consulting engineering services, related services provided by manufacturers; DA services provided by smart grid consulting specialists)

Importantly, in the chart below, note the pivotal role played by communications networks developed specifically for distribution automation applications being implemented by utilities across the nation.  The market overview (DA08) further allocates DA communications spending estimates by three external service types: (BPL/PLC/DLC), Cellular and 900 MHz MAS.

Three related T&D market series have been published over the past several weeks by Newton-Evans. These include: Power and Distribution Transformers (14 summaries); High Voltage Equipment (15 summaries) and Medium Voltage Equipment (17 summaries).

Further information on each of the four updated T&D market overview series, and three series not yet updated from 2018, comprise more than 85 individual U.S. electric power industry market summaries.  The market overviews both series and individual reports, are available from Newton-Evans Research Company, P.O. Box 6512, Ellicott City, Maryland 21042.  Visit the reports page for a sample and to order reports online. Phone: 410-465-7316 or visit www.newton-evans.com for a brochure or to order any of the related report series or any of the more than 85 individual report summaries online.  Chuck Newton can be reached at cnewton@newton-evans.com.

Posted on

Update to 2019 Market Outlook for Protective Relays and Grid Modernization Efforts

Refreshing the Outlook for P&C Investments Specifically and for Grid Modernization

The Newton-Evans study of protective relays that was completed several months ago was based on a 2019 multi-month survey-based study of protection and control engineering department heads and senor staff members at key electric power utilities in 30 countries. A total of 97 utility P&C managers and staff discussed their usage patterns and plans for relay applications, protocols and telecommunications architectures as well as their investment plans for protection and control activities during the field collection phase of the study. In addition to utility surveys, more than 30 industry officials from several protective relay manufacturing firms around the world also participated in the study.

The report series provides updated information on a variety of “universally-applied” protective relay types including generator, transmission line, distribution feeder, transformer and motor protection units.

Estimates and forecasts contained in the 2019-2022 report were premised on five sources of information:

  • In-depth utility surveys and interviews of 98 utility protection and control officials located in 30 countries conducted in 2019.
  • Relay manufacturer surveys and channel member interviews together with available financial information from suppliers.
  • Protection and Control consulting firms in six countries.
  • Excerpts from related multi-client and commissioned studies undertaken and completed by Newton-Evans Research Company.
  • Economic and financial global market outlook information developed by a number of respected public and private sources (e.g., World Bank, UNDP, IMF, Bloomberg, and others).World and Regional Economic Outlook: Implications and Viewpoints for the Protective Relay Market

Continue reading Update to 2019 Market Outlook for Protective Relays and Grid Modernization Efforts

Posted on

Transmission & Distribution World – New Article by Chuck Newton

Grid Modernization from an Energy Policy Perspective in 2019

by Chuck Newton

This article has just been published in the November 21, 2019 online edition of Transmission & Distribution World.  The article is part one of a two-part series on current policy trends, first  presented by Chuck Newton at the Little Rock, Arkansas EMMOS Users Conference in September 2019.  The link to the T&D World article is here:  https://www.tdworld.com/smart-grid/grid-modernization-energy-policy-perspective-2019 .

I hope you find the article informative and helpful in navigating the fairly complex regulatory and policy-making organizations that affect and drive the U.S. electric power industry – affecting utilities, equipment manufacturers, systems and services providers, the engineering consulting community and the many millions of residential, commercial and industrial electric power users.

Kind Regards,

Chuck

Posted on

U.S. Market for Distribution Transformers Standing at $3 Billion, Based on Findings from Recent Newton-Evans Study

7 November, 2019.  Ellicott City, Maryland.  Based on the findings obtained in a recently completed study of the distribution transformer market in the United States, Newton-Evans provides the following information summary.

Distribution Transformer Market Size Estimates

The aggregated U.S. market for three groupings of distribution transformers stood at about $3 Billion in 2018 as seen in the above chart.  The market was segmented by Newton-Evans as shown here to include residential pole and pad mount units; dry type transformers, and small power/large distribution transformers ranging from 1-25 MVAs.

Institutional Barriers to U.S. Market Entry for Distribution Transformers

The third quarter 2019 Newton-Evans study included survey questions for both end-users and suppliers about any institutional barriers they see to potential market entry by non-North American manufacturers.

Among utility respondents, nearly one-half indicated compliance with recently enacted DOE regulations and recommendations for energy efficient distribution transformers as being a key barrier to market entry by foreign-based suppliers (outside of the NAFTA region). One quarter indicated “buy American” programs at their utility was also a deterrent. About 1 in 5 respondents indicated that Underwriters Lab certification was also important, and several respondents had other supporting comments to offer.

Suppliers commented that the enactment of tariffs also served as a deterrent to foreign manufacturers, while one of the largest domestic suppliers of overhead distribution transformers cited the importance of rapid post-storm response times as being a key factor in re-supplying utilities quickly. Another major U.S. transformer manufacturer cited three factors: UL Certificate requirement, DOE Efficiency requirements and “Buy American” initiatives.

Continue reading U.S. Market for Distribution Transformers Standing at $3 Billion, Based on Findings from Recent Newton-Evans Study

Posted on

Market for “Smart” RTUs Linked to Increase in Sensor Data

According to Schneider Electric, one of the world’s leading RTU manufacturers, Smart RTUs “combine the monitoring and communication capabilities of a remote terminal unit (RTU) with the processing and data-logging power of a programmable logic controller (PLC).” Two recent Newton-Evans studies take a look at Smart RTUs both inside the substation and outside in the field.

Continue reading Market for “Smart” RTUs Linked to Increase in Sensor Data

Posted on

U.S. Investor-Owned Electric Power Utility Automation Market Report

A recently published compilation of survey findings by Newton-Evans Research highlights electric power automation trends among investor-owned utilities (IOUs).

    • For control systems, IOUs tend to use more OMS analytics, are more likely to have an advanced DMS (or have plans for one), use synchrophasors for wide area monitoring, and want cybersecurity features designed as an integrated part of the control system rather than added on.

Continue reading U.S. Investor-Owned Electric Power Utility Automation Market Report

Posted on

94% of Electric Utilities Surveyed are notified of a feeder main fault event via SCADA/DMS

A Newton-Evans survey of 53 Distribution Electric Utilities shows that the overwhelming majority of respondents are notified of a feeder main fault via SCADA/DMS.

How are you notified of a feeder main fault event? (Check all that apply)
Ninety-four percent of respondents reported that they are notified of a feeder main fault event via SCADA/DMS. Forty-two percent said OMS is the source of this notification, and 25% indicated their DA system provides notification of a feeder main fault event. Many respondents indicated that more than one system – sometimes as many as four – all provide feeder main fault event notification.
Continue reading 94% of Electric Utilities Surveyed are notified of a feeder main fault event via SCADA/DMS

Posted on

Utility Plans Call for Continuation of Moderate-to-Substantial Investment in North American Distribution Grid Automation Projects

Findings Corroborate Earlier Newton-Evans Studies Regarding “Mixed” Placement of Controls of Field Devices

The Newton-Evans Research Company today released key findings from its newly published study of electric utility plans for distribution automation. Entitled “North American Distribution Automation Market Assessment and Outlook: 2018-2020” the 74-page report includes coverage of more than 30 DA-related issues.

Progress Being Made with Distribution Automation Programs
North American utilities are making progress, by and large, in developing and implementing new DA applications and installing telecommunications network upgrades to accommodate DA device transmissions. The overall DA market among North American utilities is approaching $1.5 billion and is expected to continue to grow in the near-term and mid-term.
Continue reading Utility Plans Call for Continuation of Moderate-to-Substantial Investment in North American Distribution Grid Automation Projects

Posted on

Distribution Automation Market Study Shows Increase of Distributed Generation Communications/Controls Among North American Electric Utilities

More interim findings from a Newton-Evans study currently underway, “North American Distribution Automation Market Assessment & Outlook 2018-2020,” suggest a trend of gradual integration of communications and control for the management of distributed generation (DG) and distributed energy resources (DERs) among North American electric Utilities. The growth of DG and DERs raises a number of challenges for electric utilities and asset owners who might need to integrate these new resources into their existing distribution automation systems. Here are a few mid-study observations from the survey responses that have been received so far:
Continue reading Distribution Automation Market Study Shows Increase of Distributed Generation Communications/Controls Among North American Electric Utilities

Posted on

New Distribution Automation Tracking Study Finds Utilities Implementing DA Control Logic Either In The SCADA Control Center Or In Field Devices

Initial findings from a current Newton-Evans tracking study indicate that more North American electric utilities developing Distribution Automation applications are implementing control logic for FLISR (fault location, isolation, and service restoration) and Volt-VAR in the SCADA control center. This study follows up on a 2014 survey-based study of DA that gathered responses from 75 electric utilities in the U.S. and Canada. Here are some highlights from the first 30 survey participants so far.
Continue reading New Distribution Automation Tracking Study Finds Utilities Implementing DA Control Logic Either In The SCADA Control Center Or In Field Devices

Posted on

U.S. Sales Of Distribution Automation Components Estimated At More Than $1.4 Billion In 2017, Forecast To Increase To $1.7 Billion By 2020

The Newton-Evans Research Company has announced its latest publication of a set of 9 U.S. distribution automation market top-line report summaries. The new series of market overview reports includes supplier listings, representative products, and estimated market segment size, vendor market share estimates and market outlook through 2020. Electric utilities accounted for about 92% of all purchases of distribution automation related goods and services.
Continue reading U.S. Sales Of Distribution Automation Components Estimated At More Than $1.4 Billion In 2017, Forecast To Increase To $1.7 Billion By 2020

Posted on

Multi-Part Newton-Evans Research Study Reveals Significant Growth Likely for Advanced DMS Systems and Applications

The Newton-Evans Research Company continues to assess its findings from the firm’s comprehensive 2017 study of EMS, SCADA, DMS and OMS usage patterns among utilities from more than 30 countries.
Continue reading Multi-Part Newton-Evans Research Study Reveals Significant Growth Likely for Advanced DMS Systems and Applications

Posted on

The Role of ADMS/SCADA in Building a Resilient & Reliable Distribution Grid: Part 1

This is part one of a four part series on ADMS and Distribution Automation. Part one discusses Advanced DA, differences between Distribution SCADA and ADMS, market participants, usage patterns, challenges, priorities, and comments from users.

What utilities have said
Based on a mid-2014 study of the market for Distribution Automation (along with multiple earlier studies), increasing numbers of large utilities have indicated the following:

  • Integrated systems are becoming more desirable
  • Entrenched suppliers of large control systems (EMS primarily) have an “in” but often cannot provide the required component systems for an integrated approach to DMS-OMS-GIS.
  • Many mid-size utilities consider their DSCADA systems (primarily the ACS, OSI and Telvent communities) as suitable platforms for DMS/DA.
  • A high proportion of all respondents do not yet see a need for a separate DMS. This is especially true among the mid-tier utilities.
  • DMS systems can be (and most often are) implemented in a single control center that cuts across state lines in the United States.
  • Typically, operating companies under a large holding corporation operate their own DMS or DSCADA installations.

10 attributes of advanced DA
Here are the 10 attributes of an advanced distribution automation capability based on Intelligrid’s definition:

  1. Real-time Distribution Operation Model and Analysis (DOMA)
  2. Fault Location, Isolation and Service Restoration (FLISR/FDIR)
  3. Voltage/var Control (VVC/VVO)
  4. Distribution Contingency Analysis (DCA)
  5. Multi-level Feeder Reconfiguration (MFR)
  6. Relay Protection Re-coordination (RPRC)
  7. Pre-arming of Remedial Action Schemes (PRAS)
  8. Coordination of Emergency Actions (CEmA)
  9. Coordination of Restorative Actions (CRA)
  10. Intelligent Alarm Processing (IAP)

While ADMS platforms are increasingly used by Tier One utilities, many other utilities continue to rely on their DSCADA system to manage a growing portfolio of ADA functions.

Use of DMS as of Mid-2014 (Participants in Newton-Evans’ Study)

  • Just over 40% of all respondents indicated use of a DMS as of June 2014.
  • IOUs were more likely to indicate having a DMS installation than were respondents from other utility types.
  • All of the surveyed utilities have a DSCADA capability and are likely to be applying SCADA control over basic DA functions such as capacitor bank control and recloser control.

ADMS and DSCADA market participants
The total North American DMS market is made up of ADMS and DSCADA, with some overlapping providers and some different market participants in each category. Among this North America sample of large utilities, GE and ABB/Ventyx led in mentions of current ADMS installations. OSI is also a major supplier of DSCADA and ADMS installations, but their clients tend to be mid-size utilities. All of the mentions for both GE and ABB/Ventyx were made by IOU respondents.

Posted on

North American Market for Single Phase Reclosers

During the first quarter of 2015 Newton-Evans Research Company studied the North American market for single phase reclosers. This survey based report addressed questions pertaining to purchasing volume by type (kV rating and insulation type), protection for 1-phase laterals, brands used, types of connections for recloser communications, importance of various recloser features, and other topics.

Newton-Evans found that out of 46 electric utilities who responded to the survey, 72% currently use single phase reclosers on their system and 4% plan to use them in the future. The total number of installed single phase reclosers among the survey sample included about 18,000 units, with the vast majority of those being oil insulated (as opposed to other insulation types like solid dielectric.)

Some key findings from this report suggest the following:
(1) Electric utilities predominantly use fuse protection on single phase taps rather than use a single phase recloser.
(2) While the bulk of survey respondents indicated a greater installed base of oil insulated single phase reclosers, on an average annual basis some utilities indicated they purchase many more solid dielectric reclosers than oil insulated.
(3) Nearly one-half of the respondents said that over 70% of future recloser purchases will be for new units and not for replacements.

Question: Over the next 3 years, please estimate the percentage % of 1-phase reclosers your utility will install on 1-phase laterals vs. feeder main applications.

Only a minority of new purchases of 1-phase reclosers will be installed on single phase laterals, although four utilities plan to use more than one-half of their 15kv purchases to protect single phase laterals. Three utilities plan the same (50%+) for 26kV units, none replied with any indication of any plans to use single phase reclosers of 38kV laterals.

Question: What types of connections are required for recloser communications?
Ethernet ranked as the type of connection required for DA communications, with rs-232, fiber and wireless connections also very important to this group.
RecloserComms1

Question: How are the 15kV 1-phase laterals on your system protected?
For 15kV laterals, most utilities indicated the vast majority of laterals are protected, but are protected by and large, via the use of fuses. Few 1-phase laterals are protected by reclosers and even fewer by electronic sectionalizers.

Question: What are your preferred protocol for recloser communications?
Clearly, the US utilities are still tightly aligned with DNP 3 as the most critical DA protocol, and the protocol that all manufacturers of DA devices do provide.

For more information about the market for reclosers or other research topics, give us a call: 1 800 222 2856.

Posted on

Excerpts from Newton-Evans’ North American Distribution Automation Market Assessment & Outlook: 2015-2017

header1-field

Below are some excerpts from this recent survey of 75 North American electric transmission & distribution companies.

Where are the controls located for FDIR/FLISR on your distribution system?
As had been observed and reported din earlier Newton-Evans studies of distribution automation, respondents continue to provide a mix of replies to this question. Among the 42% of utility officials indicating some implementation of FDIR/FLISR on their distribution system, many have controls implemented at two or three locations. Among the 31 utilities identified as current FDIR/FLISR user utilities, controls were listed as being located at the control center (58%), in the substation (45%) and in the field (52%).

Location of controls for 31 respondents who have feeder automation and/or FLISR
DA1June1

In the future, where do you anticipate the controls to be located for FDIR/FLISR?
Interestingly, control placement for FDIR/FLISR in the future is anticipated to be primarily in the control center, as cited by 67% of all respondents. Nearly 40% indicated future control location in the field, while 29% cited plans for substation-based controls. Eighteen percent of all respondents indicated no plans (at year-end 2014) for feeder automation.

Importantly, regardless of type or size of responding utility, the majority of participating utilities plan to use the control center based systems to manage field equipment.

Location of controls for 59 respondents who have plans for feeder automation and/or FLISR
DA2June1

Continue reading Excerpts from Newton-Evans’ North American Distribution Automation Market Assessment & Outlook: 2015-2017

Posted on

New Utility Insights on Adoption of Advanced Distribution Automation Applications

Findings from the Newton-Evans Research Company study completed in February 2015 indicate that a substantial number of electric utilities are using distribution automation technologies such as FDIR/FLISR and VVC/VVO/CVR, but the number of operating feeders currently configured with these features is still relatively low. These observations are based on a survey of 75 electric T&D utilities in the U.S. and Canada providing electric power service to 32 million customers (approximately 20% of North America’s electricity end users, according to Newton-Evans estimates.)

Percentage of all feeders that have Fault Detection Isolation Restoration (FDIR) or Fault Location Isolation Service Restoration (FLISR) Capabilities
On a summary basis, nearly one-third of the responding utilities (32%) cited their operation of one or more primary distribution feeders configured with FDIR/FLISR capabilities. However, the overall installed base of feeders with FDIR/FLISR capabilities was quite small, standing at about five percent of the total number of feeders operated by these utilities. According to the survey sample, six percent of 13-15kV feeders and seven percent of 22-26kV feeders are configured to provide FDIR/FLISR functionality.

FLISRpie1

Percentage of feeders that support integrated Volt/VAR control (VVC), Volt Var Optimization (VVO), or Conservation Voltage Reduction (CVR)
Just over half of all respondents reported having at least some feeders supporting Integrated Volt/Var Control, Volt/Var Optimization (VVC/VVO) or Conservation Voltage Reduction (CVR). The 75 respondents indicated an installed base of 34,122 feeders across 4 voltage levels: 4kV (5,094 feeders), 13kV/15kV (22,831 feeders), 22kV/26kV (4,214 feeders), and 33kV/38kV (1,983 feeders). Overall, respondents indicated that 32% of all feeders currently support VVC, VVO or CVR, but out of 4,214 feeders at the 22/24kV level about 59% support these capabilities.

VVOpie1

Percentage of utilities integrating VVC, VVO or CVR by year end 2017
Overall, 68% of the utilities replying to this question indicated that at least some feeders will support integrated IVV control/VVO and/or CVR by year-end 2017.

Decision factors for implementing VVC/VVO
Respondents indicated that “cost savings effected by reducing the need for infrastructure enhancements” was the single most-cited driver for volt-Var optimization (VVO) implementation, as reported by 38% of respondents. Additional cost savings brought about by “reducing the need for additional generation” was second in importance, at 33%. About 1 in 5 respondents also cited “regulatory compliance” as a significant driver for implementing VVO.

Other reasons mentioned for implementing include peak shaving to reduce demand costs, reducing losses, and maintaining power factor. A few utilities mentioned that VVO is either not a requirement for them or that they do not want to implement additional technology simply to raise revenue.

To see a table of contents and pricing information for the “North American Distribution Automation Market Assessment and Outlook: 2015-2017” visit our reports page

Posted on

Utility Plans Call for Continuation of Substantial Investment in North American Distribution Grid Automation Programs

Findings Corroborate Earlier Newton-Evans Studies Regarding “Mixed” Placement of Controls of Field Devices

The Newton-Evans Research Company today released key findings from its newly published study of electric utility plans for distribution automation. Entitled “North American Distribution Automation Market Assessment and Outlook: 2015-2017” the 89-page report includes coverage of more than 35 DA-related issues.

Progress Being Made with Distribution Automation Programs:
North American utilities are making good progress in developing and implementing new DA applications and telecommunications network upgrades. The overall DA market among North American utilities is approaching one billion dollars and will continue to grow each year for the foreseeable future.

DA Controls Placement:
The placement of DA controls for field devices remains mixed. While some see controls being distributed to field locations, others are placing controls on substation automation platforms, while an even larger group is using control center systems-based approaches (centered on SCADA-DMS systems).

The outlook for controls placement in the future shows that utilities are bringing more controls for fault detection, isolation and service restoration (FDIR/FLISR) and for volt/var control (VVC) into the control center as shown in these charts.

FLISRcontrols VVCcontrols

Automatic Fault Sensing:
Devices providing information such as hot line status and fault indications are becoming a mainstay in many utility DA programs. IOUs and Canadian utilities were more likely to be using automatic fault sensing devices than were their counterparts at electric cooperatives or public power utilities. Usage patterns and plans for AFS devices were strongest among the respondent subgroup of very large utilities (those serving more than 500,000 customers). Of the subgroup using AFS devices, about one-third actively utilize the status of such devices in their DA schemes.

Integration of Communications and Controls for Distributed Generation into DA System Architecture:
By year-end 2014, only about 16% of utilities indicated some use of DA-related communications/controls while another 14% plan to integrate these for DG purposes by year-end 2017. In a related question, well over one third of the respondents indicated that they have a trial deployment to manage distributed energy resources within the DA system either underway or planned.

More than 30 additional topics are covered in the 2015-2017 Newton-Evans DA report. Seventy five major and mid-size utilities were surveyed and interviewed to gather the information for the report. This group provides a substantial sample, accounting for 20% of served customers and 19% of primary feeders across North America.

A supplemental North American DA market outlook synopsis for the years 2015 through 2020 will be released in March. The outlook supplement will provide DA market outlook information based on type, size and regional location of utilities.

Additional information on the North American Distribution Automation Market Assessment and Outlook: 2015-2017 report is available from Newton-Evans Research Company, 10176 Baltimore National Pike, Suite 204, Ellicott City, Maryland 21042. Phone 1-410-465-7316 or write to info@newton-evans.com